
Page 335 - Handbook of Thermal Analysis of Construction Materials
P. 335
312 Chapter 8 - Supplementary Cementing Materials
The rate of hydration of slag cements has been followed by
conduction calorimetry, TG, and DTA. [39]–[42] The temperature of curing
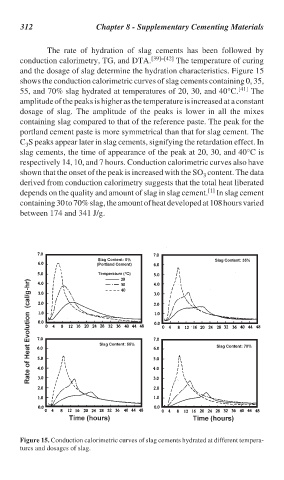
and the dosage of slag determine the hydration characteristics. Figure 15
shows the conduction calorimetric curves of slag cements containing 0, 35,
55, and 70% slag hydrated at temperatures of 20, 30, and 40°C. [41] The
amplitude of the peaks is higher as the temperature is increased at a constant
dosage of slag. The amplitude of the peaks is lower in all the mixes
containing slag compared to that of the reference paste. The peak for the
portland cement paste is more symmetrical than that for slag cement. The
C S peaks appear later in slag cements, signifying the retardation effect. In
3
slag cements, the time of appearance of the peak at 20, 30, and 40°C is
respectively 14, 10, and 7 hours. Conduction calorimetric curves also have
shown that the onset of the peak is increased with the SO content. The data
3
derived from conduction calorimetry suggests that the total heat liberated
[1]
depends on the quality and amount of slag in slag cement. In slag cement
containing 30 to 70% slag, the amount of heat developed at 108 hours varied
between 174 and 341 J/g.
Figure 15. Conduction calorimetric curves of slag cements hydrated at different tempera-
tures and dosages of slag.