
Page 234 - HVAC Pump Handbook
P. 234
Rishel_CH08.qxd 21/4/06 6:16 PM Page 231
The Use of Water in HVAC Systems
The Use of Water in HVAC Systems 231
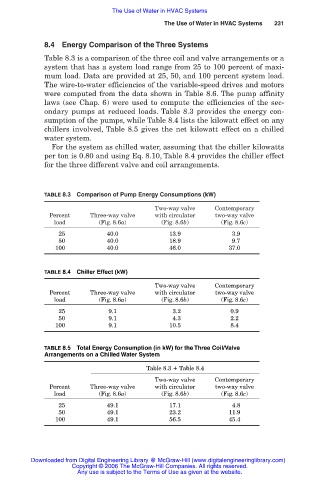
8.4 Energy Comparison of the Three Systems
Table 8.3 is a comparison of the three coil and valve arrangements or a
system that has a system load range from 25 to 100 percent of maxi-
mum load. Data are provided at 25, 50, and 100 percent system load.
The wire-to-water efficiencies of the variable-speed drives and motors
were computed from the data shown in Table 8.6. The pump affinity
laws (see Chap. 6) were used to compute the efficiencies of the sec-
ondary pumps at reduced loads. Table 8.3 provides the energy con-
sumption of the pumps, while Table 8.4 lists the kilowatt effect on any
chillers involved, Table 8.5 gives the net kilowatt effect on a chilled
water system.
For the system as chilled water, assuming that the chiller kilowatts
per ton is 0.80 and using Eq. 8.10, Table 8.4 provides the chiller effect
for the three different valve and coil arrangements.
TABLE 8.3 Comparison of Pump Energy Consumptions (kW)
Two-way valve Contemporary
Percent Three-way valve with circulator two-way valve
load (Fig. 8.6a) (Fig. 8.6b) (Fig. 8.6c)
025 40.0 13.9 3.9
050 40.0 18.9 9.7
100 40.0 46.0 37.0
TABLE 8.4 Chiller Effect (kW)
Two-way valve Contemporary
Percent Three-way valve with circulator two-way valve
load (Fig. 8.6a) (Fig. 8.6b) (Fig. 8.6c)
025 9.1 03.2 0.9
050 9.1 04.3 2.2
100 9.1 10.5 8.4
TABLE 8.5 Total Energy Consumption (in kW) for the Three Coil/Valve
Arrangements on a Chilled Water System
Table 8.3 Table 8.4
Two-way valve Contemporary
Percent Three-way valve with circulator two-way valve
load (Fig. 8.6a) (Fig. 8.6b) (Fig. 8.6c)
025 49.1 17.1 04.8
050 49.1 23.2 11.9
100 49.1 56.5 45.4
Downloaded from Digital Engineering Library @ McGraw-Hill (www.digitalengineeringlibrary.com)
Copyright © 2006 The McGraw-Hill Companies. All rights reserved.
Any use is subject to the Terms of Use as given at the website.