
Page 255 - HVAC Pump Handbook
P. 255
Rishel_09.qxd 20/4/06 6:34 PM Page 252
Configuring an HVAC Water System
252 The HVAC World
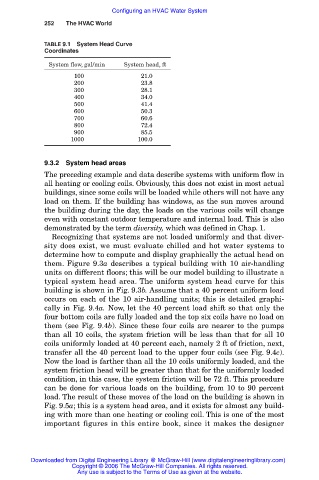
TABLE 9.1 System Head Curve
Coordinates
System flow, gal/min System head, ft
0100 021.0
0200 023.8
0300 028.1
0400 034.0
0500 041.4
0600 050.3
0700 060.6
0800 072.4
0900 085.5
1000 100.0
9.3.2 System head areas
The preceding example and data describe systems with uniform flow in
all heating or cooling coils. Obviously, this does not exist in most actual
buildings, since some coils will be loaded while others will not have any
load on them. If the building has windows, as the sun moves around
the building during the day, the loads on the various coils will change
even with constant outdoor temperature and internal load. This is also
demonstrated by the term diversity, which was defined in Chap. 1.
Recognizing that systems are not loaded uniformly and that diver-
sity does exist, we must evaluate chilled and hot water systems to
determine how to compute and display graphically the actual head on
them. Figure 9.3a describes a typical building with 10 air-handling
units on different floors; this will be our model building to illustrate a
typical system head area. The uniform system head curve for this
building is shown in Fig. 9.3b. Assume that a 40 percent uniform load
occurs on each of the 10 air-handling units; this is detailed graphi-
cally in Fig. 9.4a. Now, let the 40 percent load shift so that only the
four bottom coils are fully loaded and the top six coils have no load on
them (see Fig. 9.4b). Since these four coils are nearer to the pumps
than all 10 coils, the system friction will be less than that for all 10
coils uniformly loaded at 40 percent each, namely 2 ft of friction, next,
transfer all the 40 percent load to the upper four coils (see Fig. 9.4c).
Now the load is farther than all the 10 coils uniformly loaded, and the
system friction head will be greater than that for the uniformly loaded
condition, in this case, the system friction will be 72 ft. This procedure
can be done for various loads on the building, from 10 to 90 percent
load. The result of these moves of the load on the building is shown in
Fig. 9.5a; this is a system head area, and it exists for almost any build-
ing with more than one heating or cooling coil. This is one of the most
important figures in this entire book, since it makes the designer
Downloaded from Digital Engineering Library @ McGraw-Hill (www.digitalengineeringlibrary.com)
Copyright © 2006 The McGraw-Hill Companies. All rights reserved.
Any use is subject to the Terms of Use as given at the website.