
Page 257 - HVAC Pump Handbook
P. 257
Rishel_09.qxd 20/4/06 6:34 PM Page 254
Configuring an HVAC Water System
254 The HVAC World
60
(18.3)
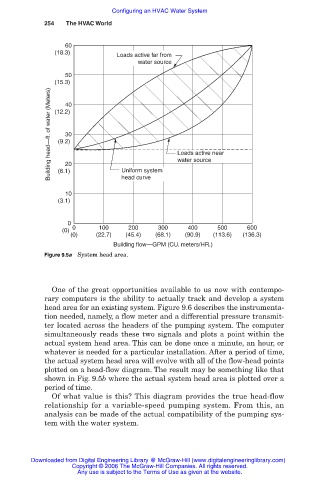
Loads active far from
water source
50
(15.3)
Building head—ft. of water (Meters) (12.2) Loads active near
40
30
(9.2)
water source
20
(6.1)
head curve
10 Uniform system
(3.1)
0
(0) 0 100 200 300 400 500 600
(0) (22.7) (45.4) (68.1) (90.9) (113.6) (136.3)
Building flow—GPM (CU. meters/HR.)
Figure 9.5a System head area.
One of the great opportunities available to us now with contempo-
rary computers is the ability to actually track and develop a system
head area for an existing system. Figure 9.6 describes the instrumenta-
tion needed, namely, a flow meter and a differential pressure transmit-
ter located across the headers of the pumping system. The computer
simultaneously reads these two signals and plots a point within the
actual system head area. This can be done once a minute, an hour, or
whatever is needed for a particular installation. After a period of time,
the actual system head area will evolve with all of the flow-head points
plotted on a head-flow diagram. The result may be something like that
shown in Fig. 9.5b where the actual system head area is plotted over a
period of time.
Of what value is this? This diagram provides the true head-flow
relationship for a variable-speed pumping system. From this, an
analysis can be made of the actual compatibility of the pumping sys-
tem with the water system.
Downloaded from Digital Engineering Library @ McGraw-Hill (www.digitalengineeringlibrary.com)
Copyright © 2006 The McGraw-Hill Companies. All rights reserved.
Any use is subject to the Terms of Use as given at the website.