
Page 258 - HVAC Pump Handbook
P. 258
Rishel_09.qxd 20/4/06 6:34 PM Page 255
Configuring an HVAC Water System
Configuring an HVAC Water System 255
80
Design point
60
System head—ft. 40 Design flow
2160 GPM
Static head
20
0
0 500 1000 1500 2000 2500
System flow—GPM
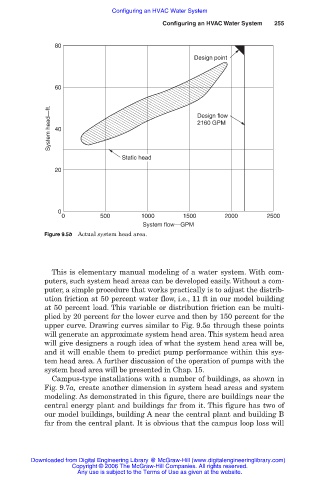
Figure 9.5b Actual system head area.
This is elementary manual modeling of a water system. With com-
puters, such system head areas can be developed easily. Without a com-
puter, a simple procedure that works practically is to adjust the distrib-
ution friction at 50 percent water flow, i.e., 11 ft in our model building
at 50 percent load. This variable or distribution friction can be multi-
plied by 20 percent for the lower curve and then by 150 percent for the
upper curve. Drawing curves similar to Fig. 9.5a through these points
will generate an approximate system head area. This system head area
will give designers a rough idea of what the system head area will be,
and it will enable them to predict pump performance within this sys-
tem head area. A further discussion of the operation of pumps with the
system head area will be presented in Chap. 15.
Campus-type installations with a number of buildings, as shown in
Fig. 9.7a, create another dimension in system head areas and system
modeling. As demonstrated in this figure, there are buildings near the
central energy plant and buildings far from it. This figure has two of
our model buildings, building A near the central plant and building B
far from the central plant. It is obvious that the campus loop loss will
Downloaded from Digital Engineering Library @ McGraw-Hill (www.digitalengineeringlibrary.com)
Copyright © 2006 The McGraw-Hill Companies. All rights reserved.
Any use is subject to the Terms of Use as given at the website.