
Page 259 - HVAC Pump Handbook
P. 259
Rishel_09.qxd 20/4/06 6:34 PM Page 256
Configuring an HVAC Water System
256 The HVAC World
F T
Flow meter
VFD
VFD
VFD
Control
center
DP T
Differential
pressure
transmitter
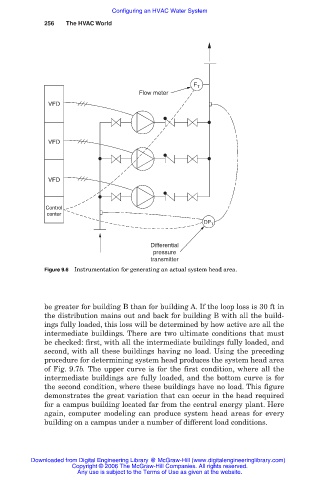
Figure 9.6 Instrumentation for generating an actual system head area.
be greater for building B than for building A. If the loop loss is 30 ft in
the distribution mains out and back for building B with all the build-
ings fully loaded, this loss will be determined by how active are all the
intermediate buildings. There are two ultimate conditions that must
be checked: first, with all the intermediate buildings fully loaded, and
second, with all these buildings having no load. Using the preceding
procedure for determining system head produces the system head area
of Fig. 9.7b. The upper curve is for the first condition, where all the
intermediate buildings are fully loaded, and the bottom curve is for
the second condition, where these buildings have no load. This figure
demonstrates the great variation that can occur in the head required
for a campus building located far from the central energy plant. Here
again, computer modeling can produce system head areas for every
building on a campus under a number of different load conditions.
Downloaded from Digital Engineering Library @ McGraw-Hill (www.digitalengineeringlibrary.com)
Copyright © 2006 The McGraw-Hill Companies. All rights reserved.
Any use is subject to the Terms of Use as given at the website.