
Page 109 - Handbook Of Multiphase Flow Assurance
P. 109
Hydrate of natural gas 105
FIG. 5.7 Fast hydrate growth at gas-water interface at 110, 150, and 190 s (Makogon, 1999).
such as KHI or kinetic hydrate inhibitors. While some KHIs may perform well at a high sub-
cooling at lower pressures (e.g. below 50 bar), their performance may deteriorate at the same
subcooling but at higher pressures. Although the terms may be seen in use interchangeably,
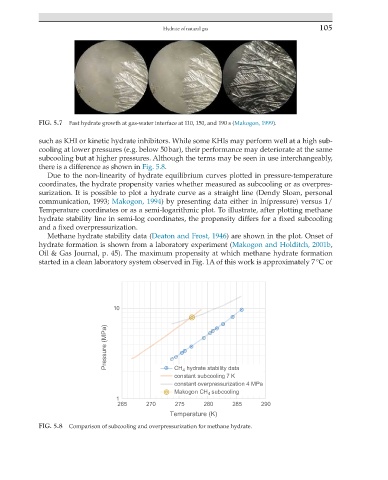
there is a difference as shown in Fig. 5.8.
Due to the non-linearity of hydrate equilibrium curves plotted in pressure-temperature
coordinates, the hydrate propensity varies whether measured as subcooling or as overpres-
surization. It is possible to plot a hydrate curve as a straight line (Dendy Sloan, personal
communication, 1993; Makogon, 1994) by presenting data either in ln(pressure) versus 1/
Temperature coordinates or as a semi-logarithmic plot. To illustrate, after plotting methane
hydrate stability line in semi-log coordinates, the propensity differs for a fixed subcooling
and a fixed overpressurization.
Methane hydrate stability data (Deaton and Frost, 1946) are shown in the plot. Onset of
hydrate formation is shown from a laboratory experiment (Makogon and Holditch, 2001b,
Oil & Gas Journal, p. 45). The maximum propensity at which methane hydrate formation
started in a clean laboratory system observed in Fig. 1A of this work is approximately 7 °C or
10
Pressure (MPa)
CH 4 hydrate stability data
constant subcooling 7 K
constant overpressurization 4 MPa
Makogon CH 4 subcooling
1
265 270 275 280 285 290
Temperature (K)
FIG. 5.8 Comparison of subcooling and overpressurization for methane hydrate.