
Page 52 - Handbook Of Multiphase Flow Assurance
P. 52
Quality of fluid samples 47
Log10 of A-2 component mass %
0.6
0.5
0.4
0.3
0.2
0.1
0
C 10 C 11 C 12 C 13 C 14 C 15 C 16 C 17 C 18 C 19 C 20 C 21 C 22 C 23 C 24 C 25 C 26 C 27 C 28 C 29 C 30 C 31 C 32 C 33 C 34 C 35
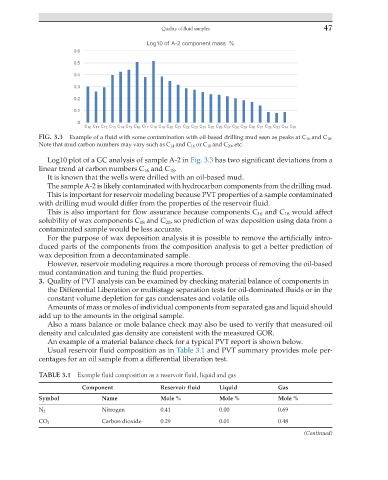
FIG. 3.3 Example of a fluid with some contamination with oil-based drilling mud seen as peaks at C 16 and C 18 .
Note that mud carbon numbers may vary such as C 14 and C 16 or C 18 and C 20 , etc.
Log10 plot of a GC analysis of sample A-2 in Fig. 3.3 has two significant deviations from a
linear trend at carbon numbers C 16 and C 18 .
It is known that the wells were drilled with an oil-based mud.
The sample A-2 is likely contaminated with hydrocarbon components from the drilling mud.
This is important for reservoir modeling because PVT properties of a sample contaminated
with drilling mud would differ from the properties of the reservoir fluid.
This is also important for flow assurance because components C 16 and C 18 would affect
solubility of wax components C 18 and C 20 , so prediction of wax deposition using data from a
contaminated sample would be less accurate.
For the purpose of wax deposition analysis it is possible to remove the artificially intro-
duced parts of the components from the composition analysis to get a better prediction of
wax deposition from a decontaminated sample.
However, reservoir modeling requires a more thorough process of removing the oil-based
mud contamination and tuning the fluid properties.
3. Quality of PVT analysis can be examined by checking material balance of components in
the Differential Liberation or multistage separation tests for oil-dominated fluids or in the
constant volume depletion for gas condensates and volatile oils
Amounts of mass or moles of individual components from separated gas and liquid should
add up to the amounts in the original sample.
Also a mass balance or mole balance check may also be used to verify that measured oil
density and calculated gas density are consistent with the measured GOR.
An example of a material balance check for a typical PVT report is shown below.
Usual reservoir fluid composition as in Table 3.1 and PVT summary provides mole per-
centages for an oil sample from a differential liberation test.
TABLE 3.1 Example fluid composition as a reservoir fluid, liquid and gas
Component Reservoir fluid Liquid Gas
Symbol Name Mole % Mole % Mole %
N 2 Nitrogen 0.41 0.00 0.69
CO 2 Carbon dioxide 0.29 0.01 0.48
(Continued)