
Page 53 - Handbook Of Multiphase Flow Assurance
P. 53
48 3. PVT and rheology investigation
Component Reservoir fluid Liquid Gas
Symbol Name Mole % Mole % Mole %
C 1 Methane 41.53 0.25 69.99
C 2 Ethane 5.40 0.29 8.92
C 3 Propane 6.60 1.32 10.24
iC 4 i-Butane 1.31 0.59 1.80
nC 4 n-Butane 3.38 2.13 4.24
iC 5 i-Pentane 1.35 1.59 1.18
nC 5 n-Pentane 1.68 2.32 1.23
iC 6 i-Hexanes 3.04 6.20 0.86
C 7 + Heptanes + 35.00 85.31 0.36
Gas-oil ratio 876 scf/stb
Gas gravity 0.874 (Air = 1.00)
Gas MW 25.2 g/mol
Oil density 884 kg/m 3 28.5 °API
Oil MW 194.9 g/mol
TABLE 3.2 Quality check example
x/z y/z
C 1 0.00602 1.685288
C 2 0.053704 1.651852
C 3 0.2 1.551515
iC 4 0.450382 1.374046
nC 4 0.630178 1.254438
iC 5 1.177778 0.874074
nC 5 1.380952 0.732143
Component mole % in liquid relative to % in total fluid, and mole % in vapor relative to % in total fluid.
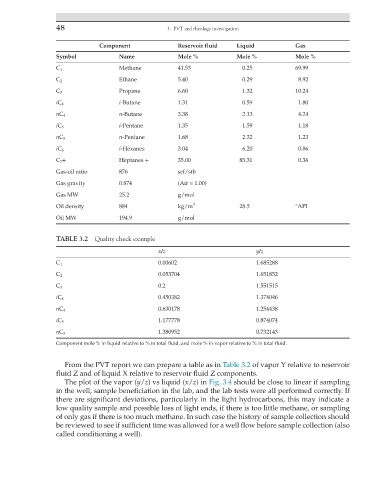
From the PVT report we can prepare a table as in Table 3.2 of vapor Y relative to reservoir
fluid Z and of liquid X relative to reservoir fluid Z components.
The plot of the vapor (y/z) vs liquid (x/z) in Fig. 3.4 should be close to linear if sampling
in the well, sample beneficiation in the lab, and the lab tests were all performed correctly. If
there are significant deviations, particularly in the light hydrocarbons, this may indicate a
low quality sample and possible loss of light ends, if there is too little methane, or sampling
of only gas if there is too much methane. In such case the history of sample collection should
be reviewed to see if sufficient time was allowed for a well flow before sample collection (also
called conditioning a well).