
Page 54 - Handbook Of Multiphase Flow Assurance
P. 54
Quality of fluid samples 49
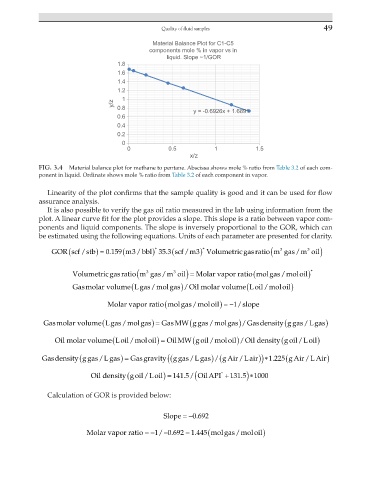
Material Balance Plot for C1-C5
components mole % in vapor vs in
liquid. Slope ~1/GOR
1.8
1.6
1.4
1.2
1
y/z 0.8
y = -0.6926x + 1.6891
0.6
0.4
0.2
0
0 0.5 1 1.5
x/z
FIG. 3.4 Material balance plot for methane to pentane. Abscissa shows mole % ratio from Table 3.2 of each com-
ponent in liquid. Ordinate shows mole % ratio from Table 3.2 of each component in vapor.
Linearity of the plot confirms that the sample quality is good and it can be used for flow
assurance analysis.
It is also possible to verify the gas oil ratio measured in the lab using information from the
plot. A linear curve fit for the plot provides a slope. This slope is a ratio between vapor com-
ponents and liquid components. The slope is inversely proportional to the GOR, which can
be estimated using the following equations. Units of each parameter are presented for clarity.
(
(
. (
)
∗
∗
/
3
3
3
/
GORscf stb) = 0 .159 ( m / bbl) 353 scfm3Volumetricgasratio mmgas moil)
/
(
(
Volumetricgasratio mgas moil) = Molar vapor ratiomolgasmolloil) ∗
3
/
3
/
(
(
Gasmolar volumeLgasmolgas)/ Oil molar volume Loil/mmoloil)
/
(
Molar vapor ratiomolgasmoloil) =−1 / slope
/
(
(
(
Gasmolar volumeLgasmolgas) = GasMW ggas molgas / ) Gasdensity gggas Lgas)
/
/
/
(
(
(
Oil molar volume Loil moloil) = OilMWgoilmoloil / ) Oil densitty goil Loil)
/
/
/
( (
(
(
Gasdensity ggas Lgas) = Gasgravity ggas Lgas / ) ( gAir Lair)) ∗1 225 gAir LAir)
1
/
/
.
/
/
. /(
(
°
5
/
Oil densitygoilLoil) = 141 5 OilAPI +131 . ) ∗1000
Calculation of GOR is provided below:
.
Slope =−0 692
=
Molar vapor ratio =−1/ −0 692 1 445 ( molgasmoloil)
.
/
.