
Page 66 - Handbook Of Multiphase Flow Assurance
P. 66
Fluid physical properties 61
(pseudo)component—(pseudo)component pairs to achieve the best fit between measured
data and predicted values. Each group of regression, such as on liquid density, can have its
own regression tolerance.
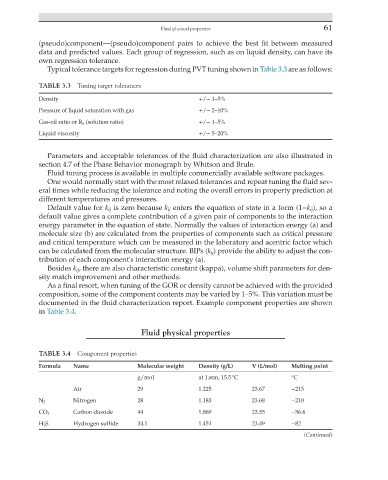
Typical tolerance targets for regression during PVT tuning shown in Table 3.3 are as follows:
TABLE 3.3 Tuning target tolerances
Density +/− 1–5%
Pressure of liquid saturation with gas +/− 2–10%
Gas-oil ratio or R S (solution ratio) +/− 1–5%
Liquid viscosity +/− 5–20%
Parameters and acceptable tolerances of the fluid characterization are also illustrated in
section 4.7 of the Phase Behavior monograph by Whitson and Brule.
Fluid tuning process is available in multiple commercially available software packages.
One would normally start with the most relaxed tolerances and repeat tuning the fluid sev-
eral times while reducing the tolerance and noting the overall errors in property prediction at
different temperatures and pressures.
Default value for k ij is zero because k ij enters the equation of state in a form (1−k ij ), so a
default value gives a complete contribution of a given pair of components to the interaction
energy parameter in the equation of state. Normally the values of interaction energy (a) and
molecule size (b) are calculated from the properties of components such as critical pressure
and critical temperature which can be measured in the laboratory and acentric factor which
can be calculated from the molecular structure. BIPs (k ij ) provide the ability to adjust the con-
tribution of each component's interaction energy (a).
Besides k ij , there are also characteristic constant (kappa), volume shift parameters for den-
sity match improvement and other methods.
As a final resort, when tuning of the GOR or density cannot be achieved with the provided
composition, some of the component contents may be varied by 1–5%. This variation must be
documented in the fluid characterization report. Example component properties are shown
in Table 3.4.
Fluid physical properties
TABLE 3.4 Component properties
Formula Name Molecular weight Density (g/L) V (L/mol) Melting point
g/mol at 1 atm, 15.5 °C °C
Air 29 1.225 23.67 −215
Nitrogen 28 1.183 23.68 −210
N 2
Carbon dioxide 44 1.869 23.55 −56.6
CO 2
H 2 S Hydrogen sulfide 34.1 1.451 23.49 −82
(Continued)