
Page 62 - Handbook Of Multiphase Flow Assurance
P. 62
Fluid characterization 57
reservoirs may be as warm as 350–400 °F, the flow assurance systems may be exposed to
temperatures as low as 0°C to −40°C in Arctic onshore or subsea environments. Typical deep-
water temperature is near +4 °C or 40 °F, and the fluid characterization developed for the res-
ervoir engineers may predict fluid properties accurately at high temperatures, but noticeably
less accurately at lower temperatures.
Fluid characterization should be done with both temperature ranges in mind so that the
same parameters of the equation of state could apply to fluid property prediction by both
reservoir and flow assurance disciplines.
It is advisable to keep the same characterization of the fluid as the one used for reservoir
analysis even if there are some inconsistencies in the VLE or other properties of the fluids
at a different conditions, in order to maintain consistency of the project analysis. However,
if the discrepancy is very significant and the flow assurance results would be significantly
improved with more accurate fluid properties, the fluid may need to be re-characterized for
flow assurance analysis using the laboratory data from the PVT report. The degree of discrep-
ancy is to be determined by each individual project.
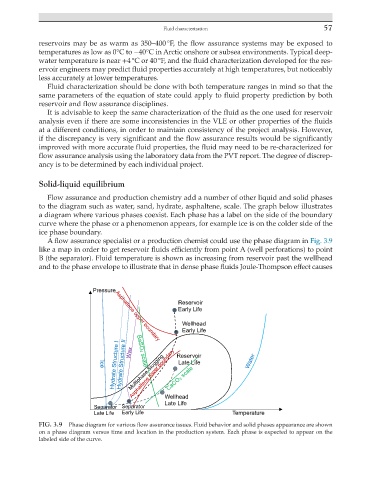
Solid-liquid equilibrium
Flow assurance and production chemistry add a number of other liquid and solid phases
to the diagram such as water, sand, hydrate, asphaltene, scale. The graph below illustrates
a diagram where various phases coexist. Each phase has a label on the side of the boundary
curve where the phase or a phenomenon appears, for example ice is on the colder side of the
ice phase boundary.
A flow assurance specialist or a production chemist could use the phase diagram in Fig. 3.9
like a map in order to get reservoir fluids efficiently from point A (well perforations) to point
B (the separator). Fluid temperature is shown as increasing from reservoir past the wellhead
and to the phase envelope to illustrate that in dense phase fluids Joule-Thompson effect causes
Pressure
Reservoir
Early Life
Wellhead
Early Life
Reservoir
Late Life
Wellhead
Late Life
Separator Separator
Late Life Early Life Temperature
FIG. 3.9 Phase diagram for various flow assurance issues. Fluid behavior and solid phases appearance are shown
on a phase diagram versus time and location in the production system. Each phase is expected to appear on the
labeled side of the curve.