
Page 519 - Handbook of Battery Materials
P. 519
492 16 The Anode/Electrolyte Interface
Transitional pores have an effective radius between 16 and 2000 ˚ A and they can
−1
2
contribute a BET surface area of 20–70 m g . The effective radius of micro-pores
is less than 20 ˚ A and can constitute 95% of the total specific BET area. The pore
structure has the following pattern: the macropores open out to the external surface
of the particle, transitional pores branch off from macropores, and micropores, in
turn, branch off from the transitional pores.
Surface species can be present at edge sites inside open and closed pores, and not
only on the external surface of the carbon particles. Some pores have very narrow
openings and are not accessible to battery electrolyte (solvents or salt), but may
be permeable to oxygen and water [68, 69]. Other pores are completely closed and
not permeable even to helium. The edge atoms in these closed pores are actually
radicals and are said to have a ‘dangling’ bond [66]. These pores are responsible for
‘extra’ reversible capacity of disordered carbons [68] and oxidized graphite [70–73].
The surface oxygen species are by far the most important group, influencing the
physicochemical properties such as wettability, catalysis, and electrical and chemical
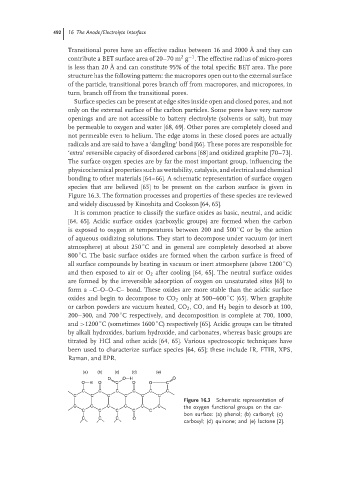
bonding to other materials [64–66]. A schematic representation of surface oxygen
species that are believed [65] to be present on the carbon surface is given in
Figure 16.3. The formation processes and properties of these species are reviewed
and widely discussed by Kinoshita and Cookson [64, 65].
It is common practice to classify the surface oxides as basic, neutral, and acidic
[64, 65]. Acidic surface oxides (carboxylic groups) are formed when the carbon
◦
is exposed to oxygen at temperatures between 200 and 500 Cor bythe action
of aqueous oxidizing solutions. They start to decompose under vacuum (or inert
◦
atmosphere) at about 250 C and in general are completely desorbed at above
◦
800 C. The basic surface oxides are formed when the carbon surface is freed of
◦
all surface compounds by heating in vacuum or inert atmosphere (above 1200 C)
and then exposed to air or O 2 after cooling [64, 65]. The neutral surface oxides
are formed by the irreversible adsorption of oxygen on unsaturated sites [65] to
form a –C–O–O–C– bond. These oxides are more stable than the acidic surface
◦
oxides and begin to decompose to CO 2 only at 500–600 C [65]. When graphite
or carbon powders are vacuum heated, CO 2 , CO, and H 2 begin to desorb at 100,
◦
200–300, and 700 C respectively, and decomposition is complete at 700, 1000,
◦
◦
and >1200 C (sometimes 1600 C) respectively [65]. Acidic groups can be titrated
by alkali hydroxides, barium hydroxide, and carbonates, whereas basic groups are
titrated by HCl and other acids [64, 65]. Various spectroscopic techniques have
been used to characterize surface species [64, 65]; these include IR, FTIR, XPS,
Raman, and EPR.
(a) (b) (c) (d) (e)
O O H O
O H O C O O C
C C C C C C
C C C C C C
Figure 16.3 Schematic representation of
C C C C C C the oxygen functional groups on the car-
C C C C C
bon surface: (a) phenol; (b) carbonyl; (c)
C C C O
carboxyl; (d) quinone; and (e) lactone [2].