
Page 616 - Handbook of Battery Materials
P. 616
590 17 Liquid Nonaqueous Electrolytes
• linear plots of κ max vs 1/r + for tetraalkylammonium hexafluorophosphates at
every temperature,
• linear plots of κ max vsµ at every temperature,
• decreasing κ max vsµ both at decreasing temperature and at decreasing viscosity
of the solvent [405].
Analysis of the activation energies of charge transport as a function of tem-
perature and concentration shows that a type of corresponding state is attained
at concentration µ characterized by constant critical energies of activation for a
given temperature. Electrolytes based on salts with small nonsolvated ions or small
Stokes radii attain high µ and κ max values, whereas those based on large ions attain
only small µ and κ max values.
Many recent examples show the importance of ionic radii and solvation for the
conductivity of concentrated solutions. Suffice it to refer three examples from the
literature. Binary mixtures of dipolar aprotic solvents of sufficiently high permittiv-
ity such as butylene carbonate (BC),PC,EC, and AN show Stokes–Walden behavior
◦
◦
[412, 413]. For Bu 4 NBr in AN/PC in the temperature range 75 C > θ > −35 Ca
linear correlation κ max (µ) is found [413], independent of temperature and solvent
composition. The use of high-permittivity solvents belonging to the same class
suppresses the effects due to strong selective solvation or effects due to changing
association.
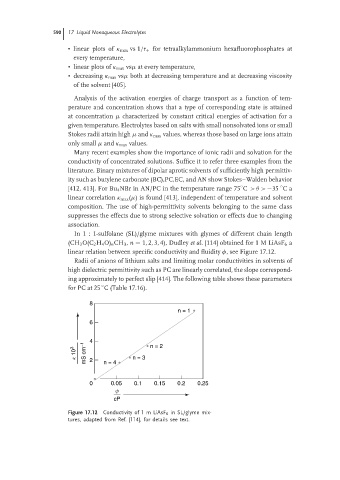
In 1 : 1-sulfolane (SL)/glyme mixtures with glymes of different chain length
(CH 3 O(C 2 H 4 O) n CH 3 , n = 1, 2, 3, 4), Dudley et al. [114] obtained for 1 M LiAsF 6 a
linear relation between specific conductivity and fluidity φ, see Figure 17.12.
Radii of anions of lithium salts and limiting molar conductivities in solvents of
high dielectric permittivity such as PC are linearly correlated, the slope correspond-
ing approximately to perfect slip [414]. The following table shows these parameters
◦
for PC at 25 C (Table 17.16).
8
n = 1
6
4 n = 2
k 10 3 mS cm −1 2 n = 4 n = 3
0 0.05 0.1 0.15 0.2 0.25
F
cP
Figure 17.12 Conductivity of 1 m LiAsF 6 in SL/glyme mix-
tures, adapted from Ref. [114], for details see text.