
Page 184 - Handbook of Civil Engineering Calculations, Second Edition
P. 184
HANGERS, CONNECTORS, AND WIND-STRESS ANALYSIS 1.167
From the AISC Manual for A440 steel:
If t 0.75 in. (19.1 mm), f y 50 kips/
sq.in. (344.7 MPa).
If 0.75 < t 1.5 in. (38 mm), f y 46 kips/
sq.in. (317.1 MPa).
If 1.5 < t 4 in. (102 mm), f y 42 kips/
sq.in. (289.5 MPa).
2. Design the body of the member,
using a trial thickness
The Specification restricts the ratio w/t to a
3
value of 8. Compute the capacity P of a /4-
in. (19.1-mm) eyebar of maximum width.
Thus w 8( /4) 6 in. (152 mm); f
3
0.6(50) 30 kips/sq.in. (206.8 MPa); P
6(0.75)30 135 kips (600.5 kN). This is
not acceptable because the desired capacity
is 175 kips (778.4 kN). Hence, the required
3
thickness exceeds the trial value of /4 in.
3
(19.1 mm). With t greater than /4 in. (19.1
mm), the allowable stress at 1 is 0.60f y , or
0.60(46 kips/sq.in.) 27.6 kips/sq.in.
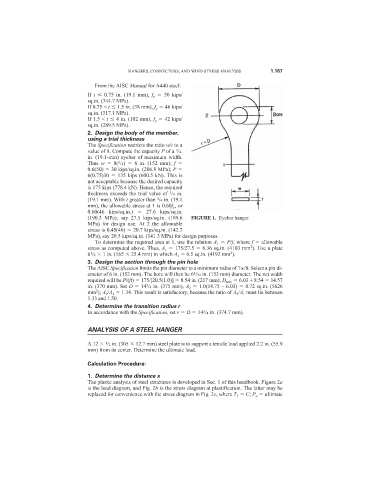
(190.3 MPa); say 27.5 kips/sq.in. (189.6 FIGURE 1. Eyebar hanger.
MPa) for design use. At 2 the allowable
stress is 0.45(46) 20.7 kips/sq.in. (142.7
MPa), say 20.5 kips/sq.in. (141.3 MPa) for design purposes.
To determine the required area at 1, use the relation A 1 P/f, where f allowable
2
stress as computed above. Thus, A 1 175/27.5 6.36 sq.in. (4103 mm ). Use a plate
2
6 /2 1 in. (165 25.4 mm) in which A 1 6.5 sq.in. (4192 mm ).
1
3. Design the section through the pin hole
The AISC Specification limits the pin diameter to a minimum value of 7w/8. Select a pin di-
1
ameter of 6 in. (152 mm). The bore will then be 6 /32 in. (153 mm) diameter. The net width
required will be P/(ft) 175/[20.5(1.0)] 8.54 in. (217 mm); D min 6.03 + 8.54 14.57
in. (370 mm). Set D 14 /4 in. (375 mm), A 2 1.0(14.75 – 6.03) 8.72 sq.in. (5626
3
2
mm ); A 2 /A 1 1.34. This result is satisfactory, because the ratio of A 2 /A 1 must lie between
1.33 and 1.50.
4. Determine the transition radius r
In accordance with the Specification, set r D 14 /4 in. (374.7 mm).
3
ANALYSIS OF A STEEL HANGER
A 12 /2 in. (305 12.7 mm) steel plate is to support a tensile load applied 2.2 in. (55.9
1
mm) from its center. Determine the ultimate load.
Calculation Procedure:
1. Determine the distance x
The plastic analysis of steel structures is developed in Sec. 1 of this handbook. Figure 2a
is the load diagram, and Fig. 2b is the stress diagram at plastification. The latter may be
replaced for convenience with the stress diagram in Fig. 2c, where T 1 C; P u ultimate