
Page 276 - Handbook of Energy Engineering Calculations
P. 276
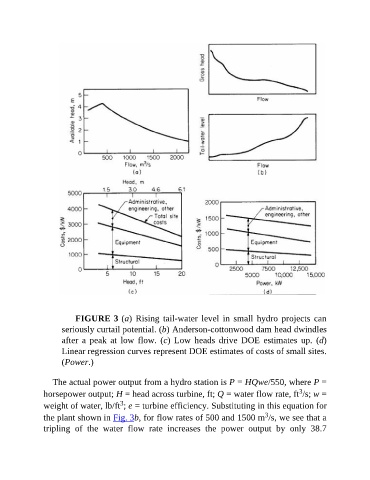
FIGURE 3 (a)  Rising  tail-water  level  in  small  hydro  projects  can
                     seriously curtail potential. (b) Anderson-cottonwood dam head dwindles

                     after  a  peak  at  low  flow.  (c)  Low  heads  drive  DOE  estimates  up.  (d)
                     Linear regression curves represent DOE estimates of costs of small sites.
                     (Power.)

                  The actual power output from a hydro station is P = HQwe/550, where P =
                                                                                                    3
               horsepower output; H = head across turbine, ft; Q = water flow rate, ft /s; w =
                                         3
               weight of water, lb/ft ; e = turbine efficiency. Substituting in this equation for
                                                                                         3
               the plant shown in Fig. 3b, for flow rates of 500 and 1500 m /s, we see that a
               tripling  of  the  water  flow  rate  increases  the  power  output  by  only  38.7