
Page 90 - Handbook of Energy Engineering Calculations
P. 90
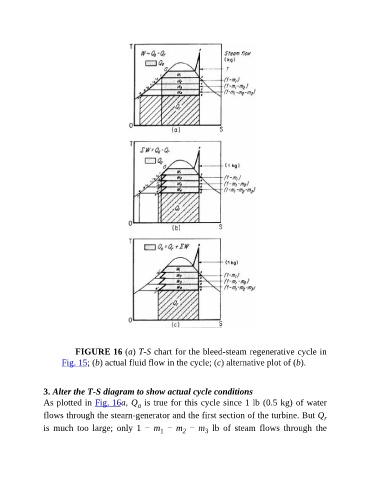
FIGURE 16 (a) T-S chart for the bleed-steam regenerative cycle in
                     Fig. 15; (b) actual fluid flow in the cycle; (c) alternative plot of (b).


               3. Alter the T-S diagram to show actual cycle conditions
               As plotted in Fig. 16a, Q  is true for this cycle since 1 lb (0.5 kg) of water
                                               a
               flows through the stearn-generator and the first section of the turbine. But Q               r

               is  much  too  large;  only  1  −  m   − m   −  m   lb  of  steam  flows  through  the
                                                                     3
                                                             2
                                                      1