
Page 91 - Handbook of Energy Engineering Calculations
P. 91
condenser. Likewise, the net areas for W , W , and W , Fig. 16a, are all too
4
2
3
large, because less than 1 lb (0.5 kg) of steam flows through the respective
turbine sections. The area for W , however, is true.
1
A true proportionate-area diagram can be plotted by applying the factors
for actual flow as in Fig. 16b. Here W , outlined by the heavy lines, equals
2
the similarly labeled area in Fig. 16a, multiplied by 1 − m . The states
1
marked 11′ and 12′, Fig. 16b, are not true state points because of the ratioing
factor applied to the area for W . The true state points 11 and 12 of the liquid
2
before and after heater pump 3 stay as shown in Fig. 16a.
Apply 1 − m − m to W of Fig. 16a. to obtain the proportionate area of
1
2
3
Fig. 16b; to obtain W , multiply by 1 − m − m − m . Multiplying by this
1
4
3
2
factor also gives Q . Then all the areas in Fig. 16b will be in proper
r
proportion for 1 lb (0.5 kg) of steam entering the turbine throttle but less in
other parts of the cycle.
In Fig. 16b, the work can be measured by the difference of the area Q and
a
the area Q . There is no simple net area left, because the areas coincide on
r
only two sides. But area enclosed by the heavy lines is the total net work W
for the cycle, equal to the sum of the work produced in the various sections of
the turbine, Fig. 16b. Then Q is the alternate area Q + W + W + W + W ,
a
3
4
2
r
1
as shaded in Fig. 16c.
The sawtooth approach of the liquid-heating line shows that as the number
of heaters in the cycle increases, the heating line approaches a line of constant
entropy. The best number of heaters for a given cycle depends on the steam
state of the turbine inlet. Many medium-pressure and medium-temperature
cycles use five to six heaters. High-pressure and high-temperature cycles use
as many as nine heaters.
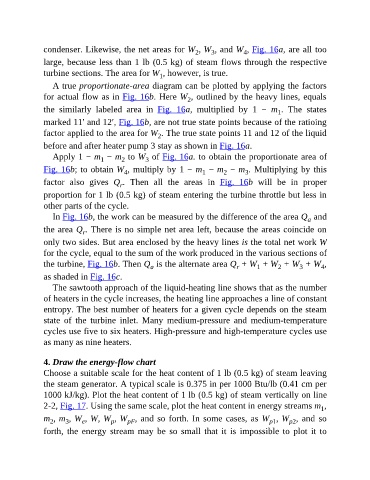
4. Draw the energy-flow chart
Choose a suitable scale for the heat content of 1 lb (0.5 kg) of steam leaving
the steam generator. A typical scale is 0.375 in per 1000 Btu/lb (0.41 cm per
1000 kJ/kg). Plot the heat content of 1 lb (0.5 kg) of steam vertically on line
2-2, Fig. 17. Using the same scale, plot the heat content in energy streams m ,
1
m , m , W , W, W , W , and so forth. In some cases, as W , W , and so
p2
3
e
p
pF
p1
2
forth, the energy stream may be so small that it is impossible to plot it to