
Page 92 - Handbook of Energy Engineering Calculations
P. 92
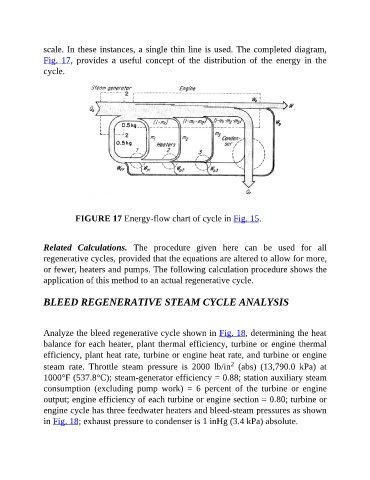
scale. In these instances, a single thin line is used. The completed diagram,
               Fig.  17,  provides  a  useful  concept  of  the  distribution  of  the  energy  in  the
               cycle.


                          FIGURE 17 Energy-flow chart of cycle in Fig. 15.


               Related  Calculations.  The  procedure  given  here  can  be  used  for  all

               regenerative cycles, provided that the equations are altered to allow for more,
               or fewer, heaters and pumps. The following calculation procedure shows the
               application of this method to an actual regenerative cycle.


               BLEED REGENERATIVE STEAM CYCLE ANALYSIS


               Analyze the bleed regenerative cycle shown in Fig. 18, determining the heat
               balance for each heater, plant thermal efficiency, turbine or engine thermal
               efficiency, plant heat rate, turbine or engine heat rate, and turbine or engine

                                                                             2
               steam  rate.  Throttle  steam  pressure  is  2000  lb/in   (abs)  (13,790.0  kPa)  at
               1000°F (537.8°C); steam-generator efficiency = 0.88; station auxiliary steam
               consumption  (excluding  pump  work)  =  6  percent  of  the  turbine  or  engine

               output; engine efficiency of each turbine or engine section = 0.80; turbine or
               engine cycle has three feedwater heaters and bleed-steam pressures as shown
               in Fig. 18; exhaust pressure to condenser is 1 inHg (3.4 kPa) absolute.