
Page 284 - Handbook of Instrumental Techniques for Analytical Chemistry
P. 284
274 Handbook of Instrumental Techniques for Analytical Chemistry
Figure 15.15 Optic diagram of the Cylindrical Internal
Reflectance Cell for Liquid Evaluation (CIRCLE). (Re-
printed by permission of Spectra-Tech, Inc.)
–1
HMDS treatment, the 3740 cm peak disappears while the broader bands from hydrogen-bonded sil-
anols remain relatively unperturbed. Baking of the silica gel to 600 °C results in the disappearance of
–1
peaks at 3660 and 3540 cm , but does not significantly affect the non– hydrogen-bonded silanols’
–1
absorption at 3740 cm . Diffuse reflectance spectra of 200 °C pretreated silica gel before and after
TiCl 4 reaction, along with the spectrum resulting from spectral subtraction are shown in Fig. 15.21
–1
(7). The IR absorption bands at 990 and 920 cm in the difference spectrum are assigned to the Si-O
stretchings of Si-O-TiCl 3 and (Si-O) 2 -TiCl 2 , respectively. Similar analyses support the other reactions
illustrated in Fig. 15.20.
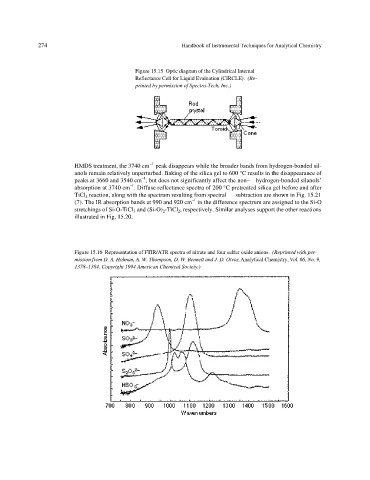
Figure 15.16 Representation of FTIR/ATR spectra of nitrate and four sulfur oxide anions. (Reprinted with per-
mission from D. A. Holman, A. W. Thompson, D. W. Bennett and J. D. Otvos, Analytical Chemistry, Vol. 66, No. 9,
1378–1384. Copyright 1994 American Chemical Society.)