
Page 233 - Handbook of Materials Failure Analysis
P. 233
4 Reliability of Water Supply and Wastewater Disposal Infrastructure 229
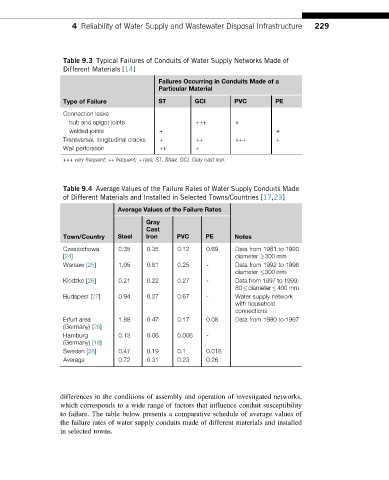
Table 9.3 Typical Failures of Conduits of Water Supply Networks Made of
Different Materials [14]
Failures Occurring in Conduits Made of a
Particular Material
Type of Failure ST GCI PVC PE
Connection leaks
hub and spigot joints +++ +
welded joints + +
Transversal, longitudinal cracks + ++ +++ +
Wall perforation ++ +
+++ very frequent; ++ frequent; + rare; ST, Steel; GCI, Gray cast iron.
Table 9.4 Average Values of the Failure Rates of Water Supply Conduits Made
of Different Materials and Installed in Selected Towns/Countries [17,23]
Average Values of the Failure Rates
Gray
Cast
Town/Country Steel Iron PVC PE Notes
Czestochowa 0.35 0.35 0.12 0.69 Data from 1981 to 1990
[24] diameter 300 mm
Warsaw [25] 1.05 0.61 0.25 - Data from 1992 to 1996
diameter 300 mm
Klodzko [26] 0.21 0.22 0.27 - Data from 1997 to 1999;
80 diameter 400 mm
Budapest [27] 0.94 0.27 0.67 - Water supply network
with household
connections
Erfurt area 1.88 0.47 0.17 0.08 Data from 1980 to 1997
(Germany) [26]
Hamburg 0.13 0.06 0.006 -
(Germany) [18]
Sweden [28] 0.47 0.19 0.1 0.018
Average 0.72 0.31 0.23 0.26
differences in the conditions of assembly and operation of investigated networks,
which corresponds to a wide range of factors that influence conduit susceptibility
to failure. The table below presents a comparative schedule of average values of
the failure rates of water supply conduits made of different materials and installed
in selected towns.