
Page 266 - Handbook of Materials Failure Analysis
P. 266
262 CHAPTER 11 The reliability design of mechanical system
Engineering Handbook [1], there are 16 activities under the heading “Verification Pro-
cedures,”almostallofwhichinvolvetesting.Thekeywordsincludeidentificationoftest
configuration, test objective, test criteria, test equipment, and location of test activity.
Similarly, verification of software includes test strategy, test plan, test procedure, test
scenario sorting deficiencies, and so on. But these are general comments or recommen-
dations that may vary according to the activity and the test article, and therefore are not
mandatory.Of coursethe test isrequiredifapplicable specifications exist, but thatisnot
sufficient.
From a verification viewpoint, NASA Handbook [8] addresses tasks used to test
products, but does not establish the detailed specification standards as the frame of
reference in which these tasks might be carried out. It is not acceptable for verifiers to
use their discretion when verifying product performance. Carefully established spec-
ifications prevent verification activities to deviate from the determined process.
Thus, when failure occurs, it is possible to determine whether the specifications
are inappropriate or whether verifiers are incorrectly conforming to the specifica-
tions. Sometimes, we can also identify omissions in the verification specifications.
Verification specifications should be established over the full range of functions
fitted to each product. A thorough use of available technology and related measures
to address issues might be applied at an early stage of product development. Why
don’t CEOs require verification specifications for each product? The reason lies
in the engineers’ answers. Product-assurance specialists may insist that all related
verification activities are included in a “thick document.” And they may add that
the activities performed are completely reviewed and revised by related specialists.
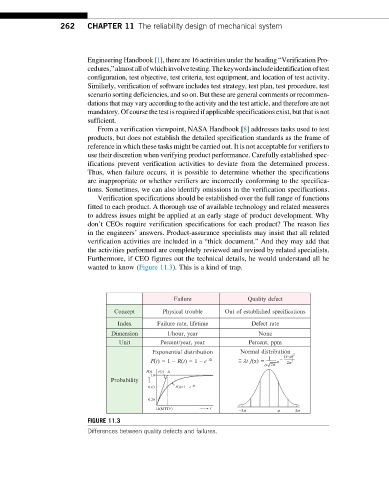
Furthermore, if CEO figures out the technical details, he would understand all he
wanted to know (Figure 11.3). This is a kind of trap.
Failure Quality defect
Concept Physical trouble Out of established specifications
Index Failure rate, lifetime Defect rate
Dimension 1/hour, year None
Unit Percent/year, year Percent, ppm
Exponential distribution Normal distribution 2
(x–m)
F(t) = 1 – R(t) = 1 – e –lt ~ 1 e – 2s 2
= lt f(x) =
s 2p
F(t) F(t)– lt
1.0
Probability
0.63 F(t)=1 – e –lt
0.20
1l(MTTF) t –3s s 3s
FIGURE 11.3
Differences between quality defects and failures.