
Page 352 - Handbook of Materials Failure Analysis
P. 352
14 Conclusion 349
E:\SharedData\Quanta Data\Commercial\S/SGS\2014\08\Particles\TR103-90_0013eds.spc
Label A: SGS Particle TRH103-90
C
Element Wt.% At.%
C K 94.01 95.43
O K 5.99 4.57
EDS Total 100 100
O
2.00 4.00 6.00 8.00 10.00 12.00 14.00 16.00 18.00 keV
(a) (b)
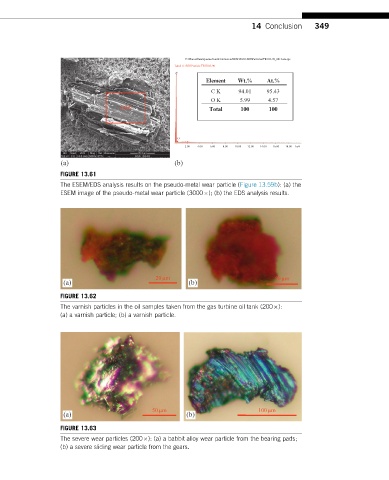
FIGURE 13.61
The ESEM/EDS analysis results on the pseudo-metal wear particle (Figure 13.59b): (a) the
ESEM image of the pseudo-metal wear particle (3000 ); (b) the EDS analysis results.
20 µm 50µm
(a) (b)
FIGURE 13.62
The varnish particles in the oil samples taken from the gas turbine oil tank (200 ):
(a) a varnish particle; (b) a varnish particle.
50µm 100µm
(a) (b)
FIGURE 13.63
The severe wear particles (200 ): (a) a babbit alloy wear particle from the bearing pads;
(b) a severe sliding wear particle from the gears.