
Page 348 - Handbook of Materials Failure Analysis
P. 348
14 Conclusion 345
50µm 50µm
(a) (b)
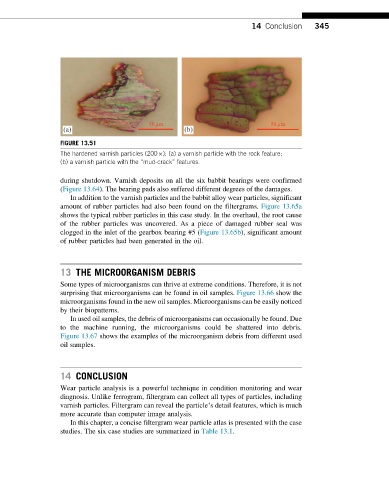
FIGURE 13.51
The hardened varnish particles (200 ): (a) a varnish particle with the rock feature;
(b) a varnish particle with the “mud-crack” features.
during shutdown. Varnish deposits on all the six babbit bearings were confirmed
(Figure 13.64). The bearing pads also suffered different degrees of the damages.
In addition to the varnish particles and the babbit alloy wear particles, significant
amount of rubber particles had also been found on the filtergrams. Figure 13.65a
shows the typical rubber particles in this case study. In the overhaul, the root cause
of the rubber particles was uncovered. As a piece of damaged rubber seal was
clogged in the inlet of the gearbox bearing #5 (Figure 13.65b), significant amount
of rubber particles had been generated in the oil.
13 THE MICROORGANISM DEBRIS
Some types of microorganisms can thrive at extreme conditions. Therefore, it is not
surprising that microorganisms can be found in oil samples. Figure 13.66 show the
microorganisms found in the new oil samples. Microorganisms can be easily noticed
by their biopatterns.
In used oil samples, the debris of microorganisms can occasionally be found. Due
to the machine running, the microorganisms could be shattered into debris.
Figure 13.67 shows the examples of the microorganism debris from different used
oil samples.
14 CONCLUSION
Wear particle analysis is a powerful technique in condition monitoring and wear
diagnosis. Unlike ferrogram, filtergram can collect all types of particles, including
varnish particles. Filtergram can reveal the particle’s detail features, which is much
more accurate than computer image analysis.
In this chapter, a concise filtergram wear particle atlas is presented with the case
studies. The six case studies are summarized in Table 13.1.