
Page 344 - Handbook of Materials Failure Analysis
P. 344
E:\SharedData\Quanta Data\Commercial\S\SGS\201\A-eds.spc
Label A: SGS A CCL22
Sn
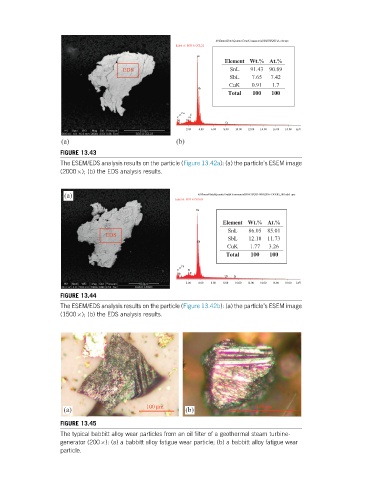
Element Wt.% At.%
EDS SnL 91.43 90.89
SbL 7.65 7.42
CuK 0.91 1.7
Sb
Total 100 100
Cu
O S
C Pt
N Si
Cu
2.00 4.00 6.00 8.00 10.00 12.00 14.00 16.00 18.00 keV
(a) (b)
FIGURE 13.43
The ESEM/EDS analysis results on the particle (Figure 13.42a): (a) the particle’s ESEM image
(2000 ); (b) the EDS analysis results.
(a) E:\SharedData\Quanta Data\Commercial\S\SGS\2014\06\25\E-CRX85_001eds1.spc
Label A: SGS E CRX85
Sn
Element Wt.% At.%
SnL 86.05 85.01
EDS
SbL 12.18 11.73
Sb
CuK 1.77 3.26
Total 100 100
Cu
O
C Pt
Sn S
Cu Pt
2.00 4.00 6.00 8.00 10.00 12.00 14.00 16.00 18.00 keV
FIGURE 13.44
The ESEM/EDS analysis results on the particle (Figure 13.42b): (a) the particle’s ESEM image
(1500 ); (b) the EDS analysis results.
100µm 100µm
(a) (b)
FIGURE 13.45
The typical babbitt alloy wear particles from an oil filter of a geothermal steam turbine-
generator (200 ): (a) a babbitt alloy fatigue wear particle; (b) a babbitt alloy fatigue wear
particle.