
Page 340 - Handbook of Materials Failure Analysis
P. 340
12 Oil Degradation Particles 337
E:\SharedData\Quanta Data\
Element Wt.%
Label A: SGS COBMDK11 11Mar2014
C K 39.21
Cu O K 4.11
Zn
SiK 0.33
EDS PtM 1.82
S K 0.42
FeK 0.37
CuK 33.07
ZnK 18.81
C
Cu
PbL 1.86
Pb Zn
S Total 100
O Pt
Si
Pb
2.00 4.00 6.00 8.00 10.00 12.00 14.00 16.00 18.00 keV
(a) (b)
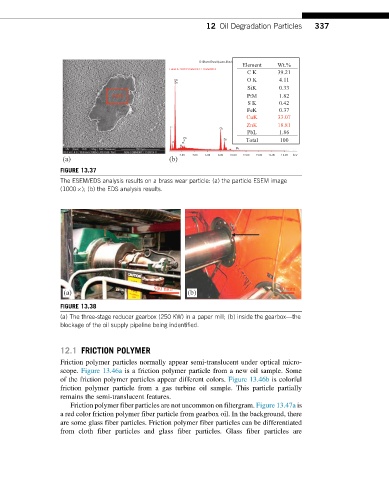
FIGURE 13.37
The ESEM/EDS analysis results on a brass wear particle: (a) the particle ESEM image
(1000 ); (b) the EDS analysis results.
500 mm 50 mm
(a) (b)
FIGURE 13.38
(a) The three-stage reducer gearbox (250 KW) in a paper mill; (b) inside the gearbox—the
blockage of the oil supply pipeline being indentified.
12.1 FRICTION POLYMER
Friction polymer particles normally appear semi-translucent under optical micro-
scope. Figure 13.46a is a friction polymer particle from a new oil sample. Some
of the friction polymer particles appear different colors. Figure 13.46b is colorful
friction polymer particle from a gas turbine oil sample. This particle partially
remains the semi-translucent features.
Friction polymer fiber particles are not uncommon on filtergram. Figure 13.47a is
a red color friction polymer fiber particle from gearbox oil. In the background, there
are some glass fiber particles. Friction polymer fiber particles can be differentiated
from cloth fiber particles and glass fiber particles. Glass fiber particles are