
Page 359 - Handbook of Materials Failure Analysis
P. 359
1 Introduction 357
cracks often propagate on the plane of maximum normal stress (with exceptions of
torsional and multiaxial loading) [1]. When the fatigue crack has reached a critical
length, final fracture will occur. Fatigue cracks prior to fracture may range from very
small cracks (1% of the fracture surface) to very large cracks ( 100%), depending on
the load level and fracture toughness of the material [1].
The research on the fatigue of metals started in the nineteenth century [5,6], and
since then numerous studies have been performed on this topic. These studies
followed two major approaches: fatigue characterization and fatigue modeling.
The fatigue characterization approach investigates the macro- and microstructure
of materials before, during, and after cyclic loading and explains the mechanism
of fatigue failure. The fatigue modeling approach predicts the fatigue failure location
and service life of a component or structure under a given loading condition. With all
the studies, this phenomenon is still not fully understood because of the complexities
involved in the fatigue process [4,7], such as micromechanism of cyclic plastic defor-
mation, and determination of the crack propagation path.
Fatigue of welds is even more complex. Welding processes often cause liquation
and rapid solidification which result in different microstructure in the weld region
than in the base metal. Deposition of filler metals in arc welding increases the inho-
mogeneity of the weld region. Residual stresses induced in the weld region due to the
solidification and shrinkage affect the fatigue strength. Also, stress concentration
around the weld and imperfections inside the weld, for example, porosity, undercuts,
etc., add to the complexity of the fatigue process [8].
In welded structures, the weld regions are very prone to fatigue failure because of
the stress concentration, tensile residual stress, etc. Therefore, assessing the fatigue
strength of welds has a great significance. This topic has attracted researchers’ atten-
tion and several models have been proposed to predict the fatigue life of welded
structures. From the fatigue modeling perspective, welded joints are often divided
into seam welds and spot-welds [8,9], because they are quite different in stress ana-
lyses. The focus in this chapter is on spot-welds; therefore, the common approaches
for fatigue modeling of spot-welds are briefly introduced. It is noteworthy that the
fatigue models explained in this chapter have been developed based on the fatigue
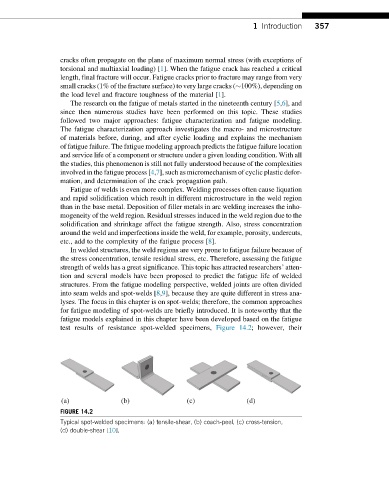
test results of resistance spot-welded specimens, Figure 14.2; however, their
(a) (b) (c) (d)
FIGURE 14.2
Typical spot-welded specimens: (a) tensile-shear, (b) coach-peel, (c) cross-tension,
(d) double-shear [10].