
Page 220 - Handbook of Properties of Textile and Technical Fibres
P. 220
Engineering properties of spider silk 195
Tape/adhesive
Spider silk
Cardboard
Tape/adhesive
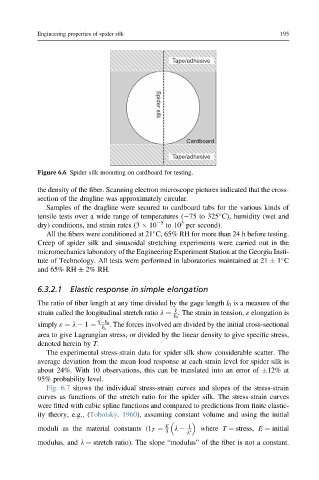
Figure 6.6 Spider silk mounting on cardboard for testing.
the density of the fiber. Scanning electron microscope pictures indicated that the cross-
section of the dragline was approximately circular.
Samples of the dragline were secured to cardboard tabs for the various kinds of
tensile tests over a wide range of temperatures ( 75 to 325 C), humidity (wet and
3
dry) conditions, and strain rates (3 10 5 to 10 per second).
All the fibers were conditioned at 21 C, 65% RH for more than 24 h before testing.
Creep of spider silk and sinusoidal stretching experiments were carried out in the
micromechanics laboratory of the Engineering Experiment Station at the Georgia Insti-
tute of Technology. All tests were performed in laboratories maintained at 21 1 C
and 65% RH 2% RH.
6.3.2.1 Elastic response in simple elongation
The ratio of fiber length at any time divided by the gage length l 0 is a measure of the
strain called the longitudinal stretch ratio l ¼ . The strain in tension, ε elongation is
[
[ 0
[ [ 0
simply ε ¼ l 1 ¼ . The forces involved are divided by the initial cross-sectional
[ 0
area to give Lagrangian stress, or divided by the linear density to give specific stress,
denoted herein by T.
The experimental stress-strain data for spider silk show considerable scatter. The
average deviation from the mean load response at each strain level for spider silk is
about 24%. With 10 observations, this can be translated into an error of 12% at
95% probability level.
Fig. 6.7 shows the individual stress-strain curves and slopes of the stress-strain
curves as functions of the stretch ratio for the spider silk. The stress-strain curves
were fitted with cubic spline functions and compared to predictions from finite elastic-
ity theory, e.g., (Tobolsky, 1960), assuming constant volume and using the initial
E 1
moduli as the material constants (1 T ¼ l where T ¼ stress, E ¼ initial
3 l 2
modulus, and l ¼ stretch ratio). The slope “modulus” of the fiber is not a constant.