
Page 221 - Handbook of Properties of Textile and Technical Fibres
P. 221
196 Handbook of Properties of Textile and Technical Fibres
400
Experimental data with spline fit
Finite elasticity prediction
350 Slope of stress–strain curve
Specific gravity =1.25 g/cc
Linear density =0.085 denier
300
Stress T (dyne/cm 3 )*10 8 200
250
150
100
50
0
1.00 1.05 1.10 1.15 1.20 1.25 1.30 1.35 1.40
Stretch ratio λ
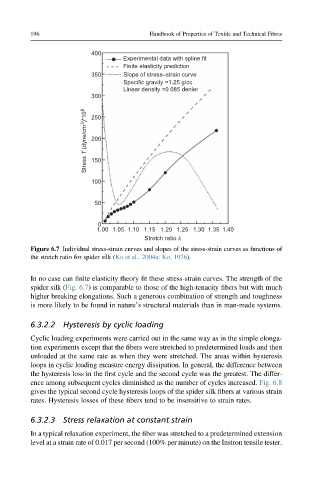
Figure 6.7 Individual stress-strain curves and slopes of the stress-strain curves as functions of
the stretch ratio for spider silk (Ko et al., 2004a; Ko, 1976).
In no case can finite elasticity theory fit these stress-strain curves. The strength of the
spider silk (Fig. 6.7) is comparable to those of the high-tenacity fibers but with much
higher breaking elongations. Such a generous combination of strength and toughness
is more likely to be found in nature’s structural materials than in man-made systems.
6.3.2.2 Hysteresis by cyclic loading
Cyclic loading experiments were carried out in the same way as in the simple elonga-
tion experiments except that the fibers were stretched to predetermined loads and then
unloaded at the same rate as when they were stretched. The areas within hysteresis
loops in cyclic loading measure energy dissipation. In general, the difference between
the hysteresis loss in the first cycle and the second cycle was the greatest. The differ-
ence among subsequent cycles diminished as the number of cycles increased. Fig. 6.8
gives the typical second cycle hysteresis loops of the spider silk fibers at various strain
rates. Hysteresis losses of these fibers tend to be insensitive to strain rates.
6.3.2.3 Stress relaxation at constant strain
In a typical relaxation experiment, the fiber was stretched to a predetermined extension
level at a strain rate of 0.017 per second (100% per minute) on the Instron tensile tester.