
Page 224 - Handbook of Properties of Textile and Technical Fibres
P. 224
Engineering properties of spider silk 199
6.3.2.4 Creep at constant loads
Measuring the creep of spider silk was carried out using a microtensile tester wherein
the fiber can be tested in a horizontal position avoiding difficulty created by
gravitation.
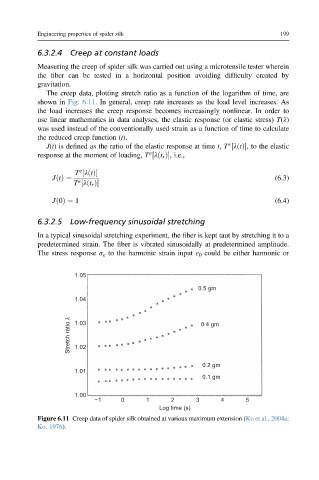
The creep data, plotting stretch ratio as a function of the logarithm of time, are
shown in Fig. 6.11. In general, creep rate increases as the load level increases. As
the load increases the creep response becomes increasingly nonlinear. In order to
use linear mathematics in data analyses, the elastic response (or elastic stress) T(l)
was used instead of the conventionally used strain as a function of time to calculate
the reduced creep function (t).
e
J(t)isdefined as the ratio of the elastic response at time t, T ½lðtÞ, to the elastic
e
response at the moment of loading, T ½lðt r Þ, i.e.,
e
T ½lðtÞ
JðtÞ¼ e (6.3)
T ½lðt r Þ
Jð0Þ ¼ 1 (6.4)
6.3.2.5 Low-frequency sinusoidal stretching
In a typical sinusoidal stretching experiment, the fiber is kept taut by stretching it to a
predetermined strain. The fiber is vibrated sinusoidally at predetermined amplitude.
The stress response s e to the harmonic strain input ε 0 could be either harmonic or
1.05
0.5 gm
1.04
Stretch ratio λ 1.03 0.4 gm
1.02
0.2 gm
1.01
0.1 gm
1.00
−1 0 1 2 3 4 5
Log time (s)
Figure 6.11 Creep data of spider silk obtained at various maximum extension (Ko et al., 2004a;
Ko, 1976).