
Page 223 - Handbook of Properties of Textile and Technical Fibres
P. 223
198 Handbook of Properties of Textile and Technical Fibres
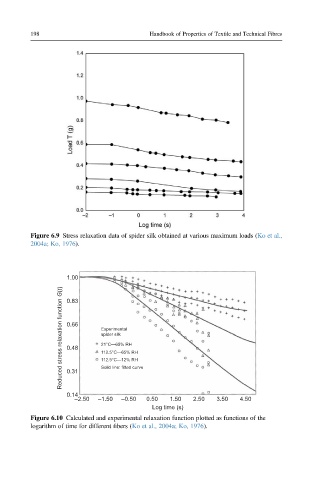
Figure 6.9 Stress relaxation data of spider silk obtained at various maximum loads (Ko et al.,
2004a; Ko, 1976).
1.00
Reduced stress relaxation function G(t) 0.66 Experimental
0.83
spider silk
21°C—65% RH
0.48
112.5°C—65% RH
112.5°C—12% RH
0.31
0.14 Solid line: fitted curve
–2.50 –1.50 –0.50 0.50 1.50 2.50 3.50 4.50
Log time (s)
Figure 6.10 Calculated and experimental relaxation function plotted as functions of the
logarithm of time for different fibers (Ko et al., 2004a; Ko, 1976).