
Page 222 - Handbook of Properties of Textile and Technical Fibres
P. 222
Engineering properties of spider silk 197
37.5
1.67x10 −3
25.0 −3
8.33x10
Load T (g)
12.5
0.0
1.0 1.2 1.4
λ
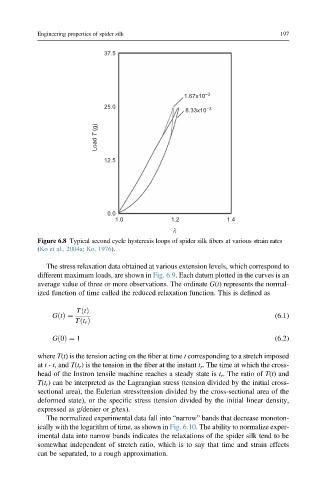
Figure 6.8 Typical second cycle hysteresis loops of spider silk fibers at various strain rates
(Ko et al., 2004a; Ko, 1976).
The stress relaxation data obtained at various extension levels, which correspond to
different maximum loads, are shown in Fig. 6.9. Each datum plotted in the curves is an
average value of three or more observations. The ordinate G(t) represents the normal-
ized function of time called the reduced relaxation function. This is defined as
TðtÞ
GðtÞ¼ (6.1)
Tðt r Þ
Gð0Þ¼ 1 (6.2)
where T(t) is the tension acting on the fiber at time t corresponding to a stretch imposed
at t - t, and T(t r ) is the tension in the fiber at the instant t r . The time at which the cross-
head of the Instron tensile machine reaches a steady state is t r . The ratio of T(t)and
T(t r ) can be interpreted as the Lagrangian stress (tension divided by the initial cross-
sectional area), the Eulerian stress(tension divided by the cross-sectional area of the
deformed state), or the specific stress (tension divided by the initial linear density,
expressed as g/denier or g/tex).
The normalized experimental data fall into “narrow” bands that decrease monoton-
ically with the logarithm of time, as shown in Fig. 6.10. The ability to normalize exper-
imental data into narrow bands indicates the relaxations of the spider silk tend to be
somewhat independent of stretch ratio, which is to say that time and strain effects
can be separated, to a rough approximation.