
Page 526 - Handbook of Properties of Textile and Technical Fibres
P. 526
Tensile failure of polyester fibers 499
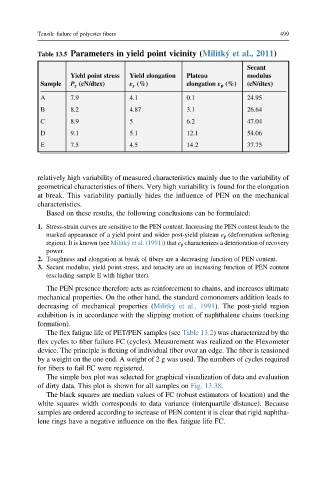
Table 13.5 Parameters in yield point vicinity (Militký et al., 2011)
Secant
Yield point stress Yield elongation Plateau modulus
Sample P y (cN/dtex) ε y (%) elongation ε p (%) (cN/dtex)
A 7.9 4.1 0.1 24.95
B 8.2 4.87 3.1 26.64
C 8.9 5 6.2 47.04
D 9.1 5.1 12.1 54.06
E 7.5 4.5 14.2 37.75
relatively high variability of measured characteristics mainly due to the variability of
geometrical characteristics of fibers. Very high variability is found for the elongation
at break. This variability partially hides the influence of PEN on the mechanical
characteristics.
Based on these results, the following conclusions can be formulated:
1. Stress-strain curves are sensitive to the PEN content. Increasing the PEN content leads to the
marked appearance of a yield point and wider post-yield plateau e p (deformation softening
region). It is known (see Militký et al. (1991)) that e p characterizes a deterioration of recovery
power.
2. Toughness and elongation at break of fibers are a decreasing function of PEN content.
3. Secant modulus, yield point stress, and tenacity are an increasing function of PEN content
(excluding sample E with higher titer).
The PEN presence therefore acts as reinforcement to chains, and increases ultimate
mechanical properties. On the other hand, the standard comonomers addition leads to
decreasing of mechanical properties (Militký et al., 1991). The post-yield region
exhibition is in accordance with the slipping motion of naphthalene chains (necking
formation).
The flex fatigue life of PET/PEN samples (see Table 13.2) was characterized by the
flex cycles to fiber failure FC (cycles). Measurement was realized on the Flexometer
device. The principle is flexing of individual fiber over an edge. The fiber is tensioned
by a weight on the one end. A weight of 2 g was used. The numbers of cycles required
for fibers to fail FC were registered.
The simple box plot was selected for graphical visualization of data and evaluation
of dirty data. This plot is shown for all samples on Fig. 13.38.
The black squares are median values of FC (robust estimators of location) and the
white squares width corresponds to data variance (interquartile distance). Because
samples are ordered according to increase of PEN content it is clear that rigid naphtha-
lene rings have a negative influence on the flex fatigue life FC.