
Page 523 - Handbook of Properties of Textile and Technical Fibres
P. 523
496 Handbook of Properties of Textile and Technical Fibres
connected with T g by inclusion of PEN to PET. The addition of PEN improves the gas
barrier properties as well (Cook et al., 1946).
It is known that the introduction of even a low level of 2,6-naphthalene units in
place of terephthalate moieties acts to disrupt crystallinity, increase T g , improve static
chain packing, and decrease local segmental mobility in the amorphous phase of
copolymers.
Comprehensive investigation of the influence of PEN content on the properties of
PEN/PET fibers was published by Militký and Aneja (2004) and Militký et al. (2011).
They prepared five distinct samples of PEN/PET fibers under comparable conditions.
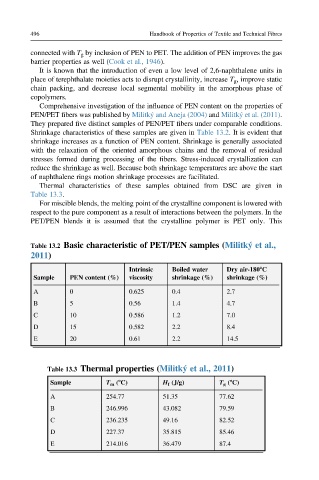
Shrinkage characteristics of these samples are given in Table 13.2. It is evident that
shrinkage increases as a function of PEN content. Shrinkage is generally associated
with the relaxation of the oriented amorphous chains and the removal of residual
stresses formed during processing of the fibers. Stress-induced crystallization can
reduce the shrinkage as well. Because both shrinkage temperatures are above the start
of naphthalene rings motion shrinkage processes are facilitated.
Thermal characteristics of these samples obtained from DSC are given in
Table 13.3.
For miscible blends, the melting point of the crystalline component is lowered with
respect to the pure component as a result of interactions between the polymers. In the
PET/PEN blends it is assumed that the crystalline polymer is PET only. This
Table 13.2 Basic characteristic of PET/PEN samples (Militký et al.,
2011)
Intrinsic Boiled water Dry air-1808C
Sample PEN content (%) viscosity shrinkage (%) shrinkage (%)
A 0 0.625 0.4 2.7
B 5 0.56 1.4 4.7
C 10 0.586 1.2 7.0
D 15 0.582 2.2 8.4
E 20 0.61 2.2 14.5
Table 13.3 Thermal properties (Militký et al., 2011)
Sample T m (8C) H f (J/g) T g (8C)
A 254.77 51.35 77.62
B 246.996 43.082 79.59
C 236.235 49.16 82.52
D 227.37 35.815 85.46
E 214.016 36.479 87.4