
Page 521 - Handbook of Properties of Textile and Technical Fibres
P. 521
494 Handbook of Properties of Textile and Technical Fibres
in the meridional direction but not fully crystallized in the equatorial direction. The
emergence of this structure is due to drawing of PEN at temperatures of 120 or
150 C. This structure persists upon annealing at 180 Cor 200 C, which leads to
the conclusion that this mesophase structure is stable at high temperatures (Jakeways
et al., 1996).
A comparison of PET and PEN fibers under tensile, creep, and fatigue conditions
leads to conclusion that both fiber types share many common characteristics but the
PEN fibers have a significantly higher initial modulus. Failure of both fibers results
in similar fracture morphologies although under high cyclic loading a new failure pro-
cess has been observed for the PEN (Lechat et al., 2006).
The influence of drawing and annealing conditions on the structure and properties
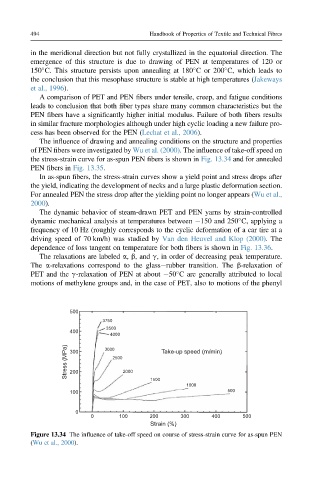
of PEN fibers were investigated by Wu et al. (2000). The influence of take-off speed on
the stress-strain curve for as-spun PEN fibers is shown in Fig. 13.34 and for annealed
PEN fibers in Fig. 13.35.
In as-spun fibers, the stress-strain curves show a yield point and stress drops after
the yield, indicating the development of necks and a large plastic deformation section.
For annealed PEN the stress drop after the yielding point no longer appears (Wu et al.,
2000).
The dynamic behavior of steam-drawn PET and PEN yarns by strain-controlled
dynamic mechanical analysis at temperatures between 150 and 250 C, applying a
frequency of 10 Hz (roughly corresponds to the cyclic deformation of a car tire at a
driving speed of 70 km/h) was studied by Van den Heuvel and Klop (2000). The
dependence of loss tangent on temperature for both fibers is shown in Fig. 13.36.
The relaxations are labeled a, b, and g, in order of decreasing peak temperature.
The a-relaxations correspond to the glasserubber transition. The b-relaxation of
PET and the g-relaxation of PEN at about 50 C are generally attributed to local
motions of methylene groups and, in the case of PET, also to motions of the phenyl
500
3750
3500
400
4000
Stress (MPa) 300 3000 2500 2000 Take-up speed (m/min)
200
1500
1000
100 500
0
0 100 200 300 400 500
Strain (%)
Figure 13.34 The influence of take-off speed on course of stress-strain curve for as-spun PEN
(Wu et al., 2000).