Page 524 - Handbook of Properties of Textile and Technical Fibres
P. 524
Tensile failure of polyester fibers                                497

           assumption has been proved experimentally (Wu and Cucullo, 1999). The lowering of
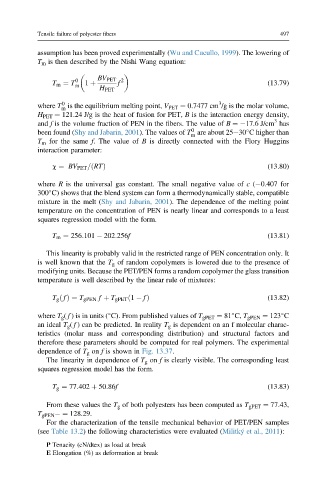
           T m is then described by the Nishi Wang equation:


                                 f
               T m ¼ T 0  1 þ  BV PET 2                                  (13.79)
                     m
                            H PET
                                                            3
                  0
           where T is the equilibrium melting point, V PET ¼ 0.7477 cm /g is the molar volume,
                  m
           H PET ¼ 121.24 J/g is the heat of fusion for PET, B is the interaction energy density,
                                                                           3
           and f is the volume fraction of PEN in the fibers. The value of B ¼ 17.6 J/cm has
                                                     0

           been found (Shy and Jabarin, 2001). The values of T are about 25e30 C higher than
                                                     m
           T m for the same f. The value of B is directly connected with the Flory Huggins
           interaction parameter:
               c ¼ BV PET =ðRTÞ                                          (13.80)
           where R is the universal gas constant. The small negative value of c ( 0.407 for

           300 C) shows that the blend system can form a thermodynamically stable, compatible
           mixture in the melt (Shy and Jabarin, 2001). The dependence of the melting point
           temperature on the concentration of PEN is nearly linear and corresponds to a least
           squares regression model with the form.
               T m ¼ 256:101   202:256f                                  (13.81)

              This linearity is probably valid in the restricted range of PEN concentration only. It
           is well known that the T g of random copolymers is lowered due to the presence of
           modifying units. Because the PET/PEN forms a random copolymer the glass transition
           temperature is well described by the linear rule of mixtures:

               T g ð f Þ¼ T gPEN f þ T gPET ð1   f Þ                     (13.82)


           where T g ( f ) is in units ( C). From published values of T gPET ¼ 81 C, T gPEN ¼ 123 C
           an ideal T g ( f ) can be predicted. In reality T g is dependent on an f molecular charac-
           teristics (molar mass and corresponding distribution) and structural factors and
           therefore these parameters should be computed for real polymers. The experimental
           dependence of T g on f is shown in Fig. 13.37.
              The linearity in dependence of T g on f is clearly visible. The corresponding least
           squares regression model has the form.

               T g ¼ 77:402 þ 50:86f                                     (13.83)

              From these values the T g of both polyesters has been computed as T gPET ¼ 77.43,
           T gPEN  ¼ 128.29.
              For the characterization of the tensile mechanical behavior of PET/PEN samples
           (see Table 13.2) the following characteristics were evaluated (Militký et al., 2011):

              P Tenacity (cN/dtex) as load at break
              E Elongation (%) as deformation at break

