
Page 74 - Handbook of Surface Improvement and Modification
P. 74
5.3 Application data 69
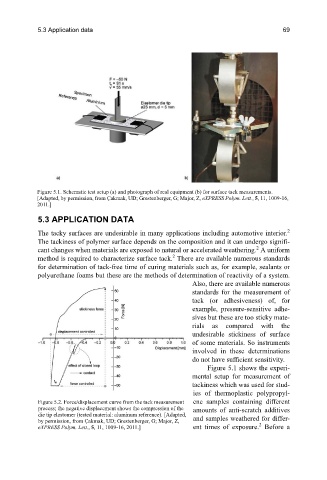
Figure 5.1. Schematic test setup (a) and photograph of real equipment (b) for surface tack measurements.
[Adapted, by permission, from Çakmak, UD; Grestenberger, G; Major, Z, eXPRESS Polym. Lett., 5, 11, 1009-16,
2011.]
5.3 APPLICATION DATA
The tacky surfaces are undesirable in many applications including automotive interior. 2
The tackiness of polymer surface depends on the composition and it can undergo signifi-
2
cant changes when materials are exposed to natural or accelerated weathering. A uniform
2
method is required to characterize surface tack. There are available numerous standards
for determination of tack-free time of curing materials such as, for example, sealants or
polyurethane foams but these are the methods of determination of reactivity of a system.
Also, there are available numerous
standards for the measurement of
tack (or adhesiveness) of, for
example, pressure-sensitive adhe-
sives but these are too sticky mate-
rials as compared with the
undesirable stickiness of surface
of some materials. So instruments
involved in these determinations
do not have sufficient sensitivity.
Figure 5.1 shows the experi-
mental setup for measurement of
tackiness which was used for stud-
ies of thermoplastic polypropyl-
Figure 5.2. Force/displacement curve from the tack measurement ene samples containing different
process; the negative displacement shows the compression of the amounts of anti-scratch additives
die tip elastomer (tested material: aluminum reference). [Adapted,
by permission, from Çakmak, UD; Grestenberger, G; Major, Z, and samples weathered for differ-
2
eXPRESS Polym. Lett., 5, 11, 1009-16, 2011.] ent times of exposure. Before a