
Page 262 - How To Implement Lean Manufacturing
P. 262
240 Cha pte r S i x tee n
The OEE Initiative
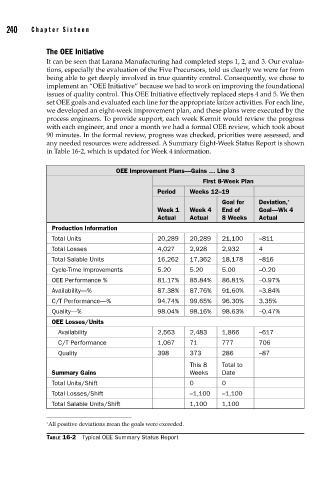
It can be seen that Larana Manufacturing had completed steps 1, 2, and 3. Our evalua-
tions, especially the evaluation of the Five Precursors, told us clearly we were far from
being able to get deeply involved in true quantity control. Consequently, we chose to
implement an “OEE Initiative” because we had to work on improving the foundational
issues of quality control. This OEE Initiative effectively replaced steps 4 and 5. We then
set OEE goals and evaluated each line for the appropriate kaizen activities. For each line,
we developed an eight-week improvement plan, and these plans were executed by the
process engineers. To provide support, each week Kermit would review the progress
with each engineer, and once a month we had a formal OEE review, which took about
90 minutes. In the formal review, progress was checked, priorities were assessed, and
any needed resources were addressed. A Summary Eight-Week Status Report is shown
in Table 16-2, which is updated for Week 4 information.
OEE Improvement Plans—Gains … Line 3
First 8-Week Plan
Period Weeks 12–19
Goal for Deviation, *
Week 1 Week 4 End of Goal—Wk 4
Actual Actual 8 Weeks Actual
Production Information
Total Units 20,289 20,289 21,100 –811
Total Losses 4,027 2,928 2,932 4
Total Salable Units 16,262 17,362 18,178 –816
Cycle-Time Improvements 5.20 5.20 5.00 –0.20
OEE Performance % 81.17% 85.84% 86.81% –0.97%
Availability—% 87.38% 87.76% 91.60% –3.84%
C/T Performance—% 94.74% 99.65% 96.30% 3.35%
Quality—% 98.04% 98.16% 98.63% –0.47%
OEE Losses/Units
Availability 2,563 2,483 1,866 –617
C/T Performance 1,067 71 777 706
Quality 398 373 286 –87
This 8 Total to
Summary Gains Weeks Date
Total Units/Shift 0 0
Total Losses/Shift –1,100 –1,100
Total Salable Units/Shift 1,100 1,100
∗ All positive deviations mean the goals were exceeded.
TABLE 16-2 Typical OEE Summary Status Report