
Page 263 - How To Implement Lean Manufacturing
P. 263
Using the Pr escription—Thr ee Case Studies 241
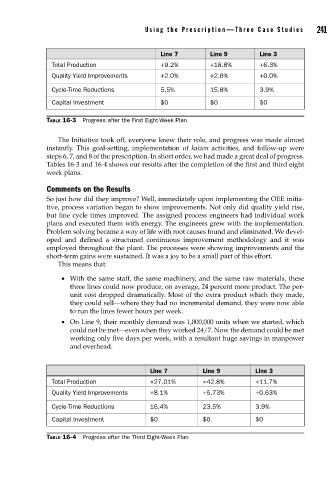
Line 7 Line 9 Line 3
Total Production +9.2% +18.8% +6.3%
Quality Yield Improvements +2.0% +2.6% +0.0%
Cycle-Time Reductions 5.5% 15.8% 3.9%
Capital Investment $0 $0 $0
TABLE 16-3 Progress after the First Eight-Week Plan
The Initiative took off, everyone knew their role, and progress was made almost
instantly. This goal-setting, implementation of kaizen activities, and follow-up were
steps 6, 7, and 8 of the prescription. In short order, we had made a great deal of progress.
Tables 16-3 and 16-4 shows our results after the completion of the first and third eight
week plans.
Comments on the Results
So just how did they improve? Well, immediately upon implementing the OEE initia-
tive, process variation began to show improvements. Not only did quality yield rise,
but line cycle times improved. The assigned process engineers had individual work
plans and executed them with energy. The engineers grew with the implementation.
Problem solving became a way of life with root causes found and eliminated. We devel-
oped and defined a structured continuous improvement methodology and it was
employed throughout the plant. The processes were showing improvements and the
short-term gains were sustained. It was a joy to be a small part of this effort.
This means that:
• With the same staff, the same machinery, and the same raw materials, these
three lines could now produce, on average, 24 percent more product. The per-
unit cost dropped dramatically. Most of the extra product which they made,
they could sell—where they had no incremental demand, they were now able
to run the lines fewer hours per week.
• On Line 9, their monthly demand was 1,000,000 units when we started, which
could not be met—even when they worked 24/7. Now the demand could be met
working only five days per week, with a resultant huge savings in manpower
and overhead.
Line 7 Line 9 Line 3
Total Production +27.01% +42.8% +11.7%
Quality Yield Improvements +8.1% +5.73% +0.63%
Cycle-Time Reductions 16.4% 23.5% 3.9%
Capital Investment $0 $0 $0
TABLE 16-4 Progress after the Third Eight-Week Plan