
Page 301 - How To Implement Lean Manufacturing
P. 301
278 Cha pte r Se v e ntee n
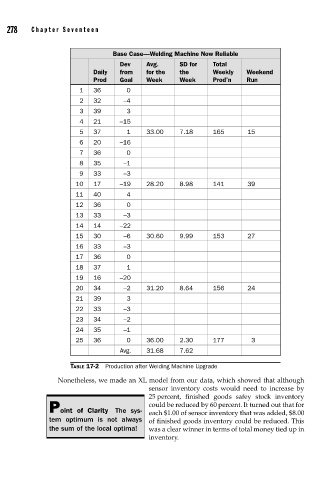
Base Case—Welding Machine Now Reliable
Dev Avg. SD for Total
Daily from for the the Weekly Weekend
Prod Goal Week Week Prod’n Run
1 36 0
2 32 –4
3 39 3
4 21 –15
5 37 1 33.00 7.18 165 15
6 20 –16
7 36 0
8 35 –1
9 33 –3
10 17 –19 28.20 8.98 141 39
11 40 4
12 36 0
13 33 –3
14 14 –22
15 30 –6 30.60 9.99 153 27
16 33 –3
17 36 0
18 37 1
19 16 –20
20 34 –2 31.20 8.64 156 24
21 39 3
22 33 –3
23 34 –2
24 35 –1
25 36 0 36.00 2.30 177 3
Avg. 31.68 7.62
TABLE 17-2 Production after Welding Machine Upgrade
Nonetheless, we made an XL model from our data, which showed that although
sensor inventory costs would need to increase by
25 percent, finished goods safey stock inventory
could be reduced by 60 percent. It turned out that for
Point of Clarity The sys- each $1.00 of sensor inventory that was added, $8.00
tem optimum is not always of finished goods inventory could be reduced. This
the sum of the local optima! was a clear winner in terms of total money tied up in
inventory.