
Page 302 - How To Implement Lean Manufacturing
P. 302
The Pr ecursors to Lean Not Handled Well 279
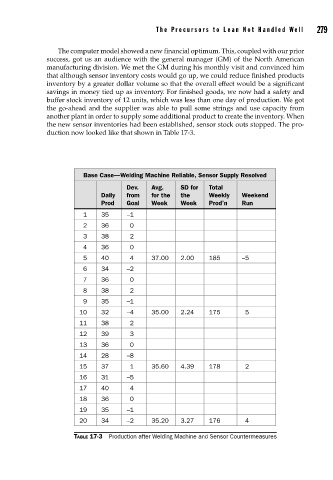
The computer model showed a new financial optimum. This, coupled with our prior
success, got us an audience with the general manager (GM) of the North American
manufacturing division. We met the GM during his monthly visit and convinced him
that although sensor inventory costs would go up, we could reduce finished products
inventory by a greater dollar volume so that the overall effect would be a significant
savings in money tied up as inventory. For finished goods, we now had a safety and
buffer stock inventory of 12 units, which was less than one day of production. We got
the go-ahead and the supplier was able to pull some strings and use capacity from
another plant in order to supply some additional product to create the inventory. When
the new sensor inventories had been established, sensor stock outs stopped. The pro-
duction now looked like that shown in Table 17-3.
Base Case—Welding Machine Reliable, Sensor Supply Resolved
Dev. Avg. SD for Total
Daily from for the the Weekly Weekend
Prod Goal Week Week Prod’n Run
1 35 –1
2 36 0
3 38 2
4 36 0
5 40 4 37.00 2.00 185 –5
6 34 –2
7 36 0
8 38 2
9 35 –1
10 32 –4 35.00 2.24 175 5
11 38 2
12 39 3
13 36 0
14 28 –8
15 37 1 35.60 4.39 178 2
16 31 –5
17 40 4
18 36 0
19 35 –1
20 34 –2 35.20 3.27 176 4
TABLE 17-3 Production after Welding Machine and Sensor Countermeasures