
Page 298 - How To Implement Lean Manufacturing
P. 298
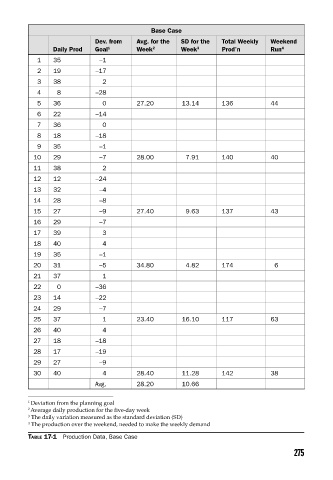
Base Case
                                  Dev. from   Avg. for the   SD for the   Total Weekly   Weekend
                      Daily Prod  Goal 1      Week 2      Week 3      Prod’n       Run 4
                  1   35           –1
                  2   19          –17
                  3   38            2
                  4    8          –28
                  5   36            0         27.20       13.14       136          44
                  6   22          –14
                  7   36            0
                  8   18          –18
                  9   35           –1
                10    29           –7         28.00        7.91       140          40
                11    38            2
                12    12          –24
                13    32           –4
                14    28           –8
                15    27           –9         27.40        9.63       137          43
                16    29           –7
                17    39            3
                18    40            4
                19    35           –1
                20    31           –5         34.80        4.82       174           6
                21    37            1
                22     0          –36
                23    14          –22
                24    29           –7
                25    37            1         23.40       16.10       117          63
                26    40            4
                27    18          –18
                28    17          –19
                29    27           –9
                30    40            4         28.40       11.28       142          38
                                  Avg.        28.20       10.66

               1 Deviation from the planning goal
               2 Average daily production for the five-day week
               3  The daily variation measured as the standard deviation (SD)
               4  The production over the weekend, needed to make the weekly demand
               TABLE 17-1  Production Data, Base Case

                                                                                          275