
Page 314 - How To Implement Lean Manufacturing
P. 314
290 Cha pte r Ei g h tee n
g. At station 8, we have enough material for 21 units, but the machine capacity
is only six; hence, only six units are produced, leaving 15 units in WIP
available for station 8 for the next cycle.
h. Six units are produced and added to the 12, so we have accumulated 18 units
of finished goods. Our WIP totals 21. The sum of finished goods plus WIP
is 39, which agrees with the total raw materials input of 39. It checks.
i. Now look at Cycle 3. Station 1 which only produces nine units, but since it had
an inventory of six from the previous cycle, it was able to produce 12 units. Had
there been no inventory, the rate would have been limited to nine.
j. In Cycle 3, the capacity and materials availability limit the production
at stations 2, 3, 4, 5, 6, and 7 to 12 units. However, because of the inventory
left over from Cycle 2, now station 8 can produce to its capacity and make
18 units. Here, the inventory has “uncoupled” the process and allowed it to
produce more than the previous processing step.
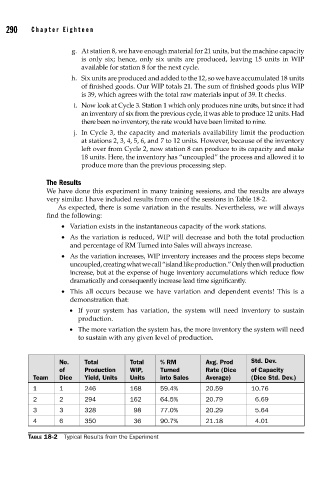
The Results
We have done this experiment in many training sessions, and the results are always
very similar. I have included results from one of the sessions in Table 18-2.
As expected, there is some variation in the results. Nevertheless, we will always
find the following:
• Variation exists in the instantaneous capacity of the work stations.
• As the variation is reduced, WIP will decrease and both the total production
and percentage of RM Turned into Sales will always increase.
• As the variation increases, WIP inventory increases and the process steps become
uncoupled, creating what we call “island like production.” Only then will production
increase, but at the expense of huge inventory accumula tions which reduce flow
dramatically and consequently increase lead time significantly.
• This all occurs because we have variation and dependent events! This is a
demonstration that:
• If your system has variation, the system will need inventory to sustain
production.
• The more variation the system has, the more inventory the system will need
to sustain with any given level of production.
No. Total Total % RM Avg. Prod Std. Dev.
of Production WIP, Turned Rate (Dice of Capacity
Team Dice Yield, Units Units into Sales Average) (Dice Std. Dev.)
1 1 246 168 59.4% 20.59 10.76
2 2 294 162 64.5% 20.79 6.69
3 3 328 98 77.0% 20.29 5.64
4 6 350 36 90.7% 21.18 4.01
TABLE 18-2 Typical Results from the Experiment