
Page 133 - Human Inspired Dexterity in Robotic Manipulation
P. 133
Hand Design—Hybrid Soft and Hard Structures 131
Phase 1
Non-deformation
Phase 2
Deformation
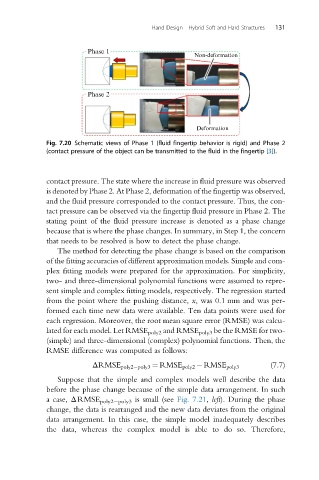
Fig. 7.20 Schematic views of Phase 1 (fluid fingertip behavior is rigid) and Phase 2
(contact pressure of the object can be transmitted to the fluid in the fingertip [3]).
contact pressure. The state where the increase in fluid pressure was observed
is denoted by Phase 2. At Phase 2, deformation of the fingertip was observed,
and the fluid pressure corresponded to the contact pressure. Thus, the con-
tact pressure can be observed via the fingertip fluid pressure in Phase 2. The
stating point of the fluid pressure increase is denoted as a phase change
because that is where the phase changes. In summary, in Step 1, the concern
that needs to be resolved is how to detect the phase change.
The method for detecting the phase change is based on the comparison
of the fitting accuracies of different approximation models. Simple and com-
plex fitting models were prepared for the approximation. For simplicity,
two- and three-dimensional polynomial functions were assumed to repre-
sent simple and complex fitting models, respectively. The regression started
from the point where the pushing distance, x, was 0.1 mm and was per-
formed each time new data were available. Ten data points were used for
each regression. Moreover, the root mean square error (RMSE) was calcu-
lated for each model. Let RMSE poly2 and RMSE poly3 be the RMSE for two-
(simple) and three-dimensional (complex) polynomial functions. Then, the
RMSE difference was computed as follows:
ΔRMSE poly2 poly3 ¼ RMSE poly2 RMSE poly3 (7.7)
Suppose that the simple and complex models well describe the data
before the phase change because of the simple data arrangement. In such
a case, ΔRMSE poly2 poly3 is small (see Fig. 7.21, left). During the phase
change, the data is rearranged and the new data deviates from the original
data arrangement. In this case, the simple model inadequately describes
the data, whereas the complex model is able to do so. Therefore,