
Page 134 - Human Inspired Dexterity in Robotic Manipulation
P. 134
132 Human Inspired Dexterity in Robotic Manipulation
2 dimensional polynomial function
3 dimensional polynomial function
DRMSE Large
DRMSE Small
Pressure Pressure
Pushing distance Pushing distance
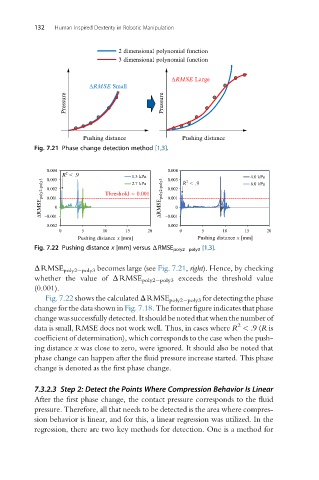
Fig. 7.21 Phase change detection method [1,3].
0.004 0.004
2
R < .9 1.5 kPa 0.003 R < .9 4.0 kPa
0.003
DRMSE poly2-poly3 0.002 0 Threshold = 0.001 DRMSE poly2-poly3 0.002 0
2
2.7 kPa
6.0 kPa
0.001
0.001
–0.001
–0.002
–0.002 –0.001
0 5 10 15 20 0 5 10 15 20
Pushing distance x [mm] Pushing distance x [mm]
Fig. 7.22 Pushing distance x [mm] versus ΔRMSE poly2 poly3 [1,3].
ΔRMSE poly2 poly3 becomes large (see Fig. 7.21, right). Hence, by checking
whether the value of ΔRMSE poly2 poly3 exceeds the threshold value
(0.001).
Fig. 7.22 shows the calculated ΔRMSE poly2 poly3 for detecting the phase
change for the data shown in Fig. 7.18. The former figure indicates that phase
change was successfully detected. It should be noted that when the number of
2
data is small, RMSE does not work well. Thus, in cases where R < .9 (R is
coefficient of determination), which corresponds to the case when the push-
ing distance x was close to zero, were ignored. It should also be noted that
phase change can happen after the fluid pressure increase started. This phase
change is denoted as the first phase change.
7.3.2.3 Step 2: Detect the Points Where Compression Behavior Is Linear
After the first phase change, the contact pressure corresponds to the fluid
pressure. Therefore, all that needs to be detected is the area where compres-
sion behavior is linear, and for this, a linear regression was utilized. In the
regression, there are two key methods for detection. One is a method for