
Page 135 - Human Inspired Dexterity in Robotic Manipulation
P. 135
Hand Design—Hybrid Soft and Hard Structures 133
checking whether the same slope of the regression line continues or not, and
the other is for the appropriate setting of the starting point for the regression.
Regression was performed each time new data were available, and the
2
coefficient of determination (R ) and the slope (a of P ¼ ax + b) of the
2
regression line were derived. Both the coefficient of determination (R )
and the deviation of the slope were evaluated. The deviation of the slope
(a d ) was determined using
10
1 X |ax k i Þ ax k
ð
ðÞ|
a d x k ¼ (7.8)
ðÞ
10 ax k
ðÞ
i¼1
where, x k is the kth point of x, and a d (x k ) is the a d at x k . If the deviation of the
slope (a d ) was less than the threshold value (.92) and the coefficient of deter-
2
mination (R ) exceeded the threshold value (.9), then it can be concluded
that the data arrangement showed a linear/elastic behavior.
For setting the starting point for the regression, the phase change detec-
tion method presented in the previous section was used and reviewed as
follows. Phase change is continuously checked after fluid pressure increase
started. The data were split into two phases at the detected phase change.
Linear regression was applied to the second phase identified right after
detecting the phase change point. Phase change indicates a change of the
fitting model. Therefore, this strategy was found suitable for detecting the
starting point for the linear behavior.
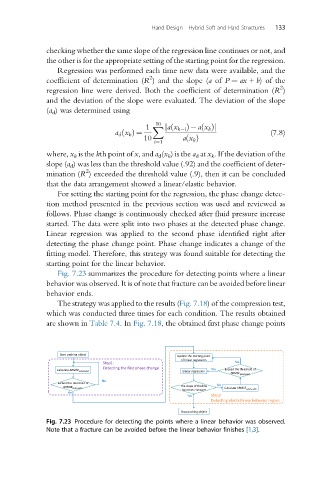
Fig. 7.23 summarizes the procedure for detecting points where a linear
behavior was observed. It is of note that fracture can be avoided before linear
behavior ends.
The strategy was applied to the results (Fig. 7.18) of the compression test,
which was conducted three times for each condition. The results obtained
are shown in Table 7.4.In Fig. 7.18, the obtained first phase change points
Fig. 7.23 Procedure for detecting the points where a linear behavior was observed.
Note that a fracture can be avoided before the linear behavior finishes [1,3].