Page 358 - Hydrocarbon Exploration and Production Second Edition
P. 358

Petroleum Economics                                                   345


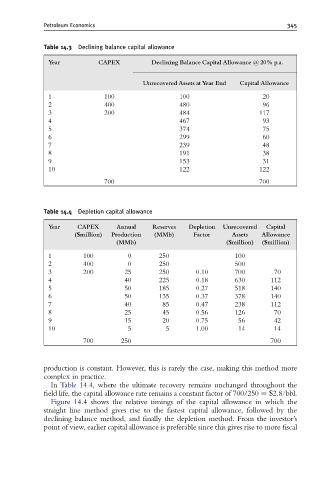
             Table 14.3  Declining balance capital allowance

               Year          CAPEX          Declining Balance Capital Allowance @ 20% p.a.

                                          Unrecovered Assets atYear End  Capital Allowance

               1               100                  100                     20
               2               400                  480                     96
               3               200                  484                    117
               4                                    467                     93
               5                                    374                     75
               6                                    299                     60
               7                                    239                     48
               8                                    191                     38
               9                                    153                     31
               10                                   122                    122
                               700                                         700


             Table 14.4  Depletion capital allowance

               Year    CAPEX      Annual    Reserves   Depletion  Unrecovered  Capital
                      ($million)  Production  (MMb)     Factor     Assets  Allowance
                                  (MMb)                          ($million)  ($million)

               1         100         0        250                   100
               2         400         0        250                   500
               3         200        25        250        0.10       700        70
               4                    40        225        0.18       630       112
               5                    50        185        0.27       518       140
               6                    50        135        0.37       378       140
               7                    40         85        0.47       238       112
               8                    25         45        0.56       126        70
               9                    15         20        0.75        56        42
               10                    5          5        1.00        14        14
                         700       250                                        700


             production is constant. However, this is rarely the case, making this method more
             complex in practice.
               In Table 14.4, where the ultimate recovery remains unchanged throughout the
             field life, the capital allowance rate remains a constant factor of 700/250 ¼ $2.8/bbl.
               Figure 14.4 shows the relative timings of the capital allowance in which the
             straight line method gives rise to the fastest capital allowance, followed by the
             declining balance method, and finally the depletion method. From the investor’s
             point of view, earlier capital allowance is preferable since this gives rise to more fiscal
   353   354   355   356   357   358   359   360   361   362   363