Page 360 - Hydrocarbon Exploration and Production Second Edition
P. 360

Petroleum Economics                                                   347


               OPEX                ¼ $15 million
               Technical cost      ¼ $95 million
               Royalty             ¼ Revenues   royalty rate ¼ $600 million   0.10 ¼ $60
                                     million
               Fiscal allowances   ¼ Royalty + OPEX + capital allowance
                                   ¼ $60 million + $15 million + $50 million
                                   ¼ $125 million
               Taxable income      ¼ Revenue fiscal allowances
                                   ¼ $600 million $125 million ¼ $475 million
               Tax                 ¼ Tax rate   taxable income
                                   ¼ 0.50   $475 million
                                   ¼ $237.5 million
               Project net cashflow  ¼ Revenues CAPEX OPEX royalty tax
                                   ¼ $600–80–15–60–237.5 million
                                   ¼ $207.5 million
               Host government take  ¼ Tax+royalty
                                   ¼ $207.5 + 60 million
                                   ¼ $267.5 million


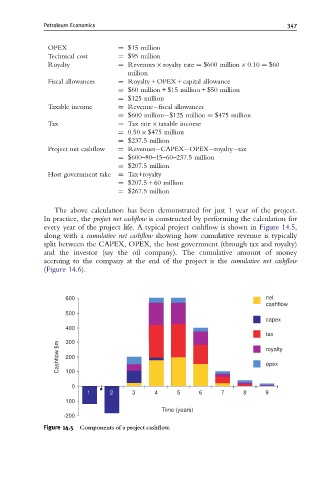
                The above calculation has been demonstrated for just 1 year of the project.
             In practice, the project net cashflow is constructed by performing the calculation for
             every year of the project life. A typical project cashflow is shown in Figure 14.5,
             along with a cumulative net cashflow showing how cumulative revenue is typically
             split between the CAPEX, OPEX, the host government (through tax and royalty)
             and the investor (say the oil company). The cumulative amount of money
             accruing to the company at the end of the project is the cumulative net cashflow
             (Figure 14.6).


                    600                                                      net
                                                                             cashflow
                    500
                                                                             capex
                    400
                                                                             tax
                    300
                  Cashflow $m  200                                           royalty

                                                                             opex
                    100

                     0
                          1     2      3     4     5      6     7     8      9
                    100
                                               Time (years)
                   -200
             Figure 14.5  Components of a project cash£ow.
   355   356   357   358   359   360   361   362   363   364   365