
Page 402 - Hydrocarbon Exploration and Production Second Edition
P. 402
Managing the Producing Field 389
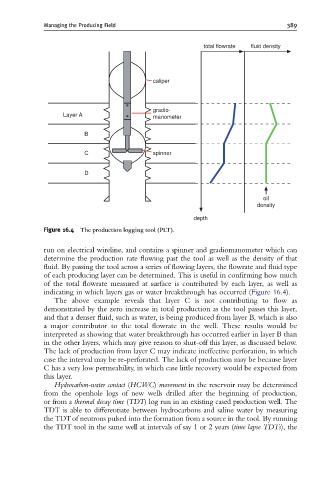
total flowrate fluid density
caliper
gradio-
Layer A
manometer
B
C spinner
D
oil
density
depth
Figure 16.4 The production logging tool (PLT).
run on electrical wireline, and contains a spinner and gradiomanometer which can
determine the production rate flowing past the tool as well as the density of that
fluid. By passing the tool across a series of flowing layers, the flowrate and fluid type
of each producing layer can be determined. This is useful in confirming how much
of the total flowrate measured at surface is contributed by each layer, as well as
indicating in which layers gas or water breakthrough has occurred (Figure 16.4).
The above example reveals that layer C is not contributing to flow as
demonstrated by the zero increase in total production as the tool passes this layer,
and that a denser fluid, such as water, is being produced from layer B, which is also
a major contributor to the total flowrate in the well. These results would be
interpreted as showing that water breakthrough has occurred earlier in layer B than
in the other layers, which may give reason to shut-off this layer, as discussed below.
The lack of production from layer C may indicate ineffective perforation, in which
case the interval may be re-perforated. The lack of production may be because layer
C has a very low permeability, in which case little recovery would be expected from
this layer.
Hydrocarbon-water contact (HCWC) movement in the reservoir may be determined
from the openhole logs of new wells drilled after the beginning of production,
or from a thermal decay time (TDT) log run in an existing cased production well. The
TDT is able to differentiate between hydrocarbons and saline water by measuring
the TDTof neutrons pulsed into the formation from a source in the tool. By running
the TDT tool in the same well at intervals of say 1 or 2 years (time lapse TDTs), the