Page 287 - Hydrogeology Principles and Practice
P. 287

HYDC07  12/5/05  5:33 PM  Page 270


                 270    Chapter Seven


                                                                                             BO X
                  Continued
                                                                                             7. 5


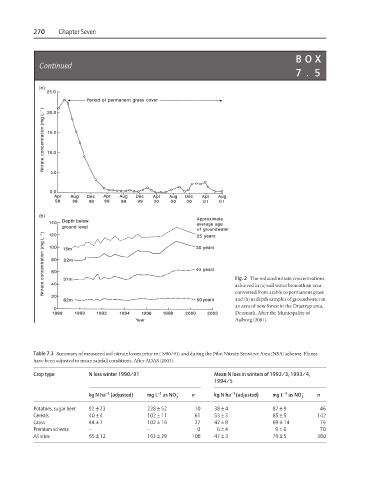
                                                                           Fig. 2 The reduced nitrate concentrations
                                                                           achieved in (a) soil water beneath an area
                                                                           converted from arable to permanent grass
                                                                           and (b) in depth samples of groundwater in
                                                                           an area of new forest in the Drastrup area,
                                                                           Denmark. After the Municipality of
                                                                           Aalborg (2001).


                 Table 7.3 Summary of measured soil nitrate losses prior to (1990/91) and during the Pilot Nitrate Sensitive Area (NSA) scheme. Fluxes
                 have been adjusted to mean rainfall conditions. After ADAS (2003).
                 Crop type       N loss winter 1990/91               Mean N loss in winters of 1992/3, 1993/4,
                                                                     1994/5
                                                                                         −1
                                                     −1
                                      −1
                                                                          −1
                                 kg N ha (adjusted)  mg L as NO −  n  kg N ha (adjusted)  mg L as NO −  n
                                                          3                                    3
                 Potatoes, sugar beet  92 ± 23    228 ± 52      10   38 ± 4           87 ± 9        46
                 Cereals         40 ± 4           102 ± 11      61   53 ± 3           85 ± 5       142
                 Grass           44 ± 7           102 ± 16      27   42 ± 8           69 ± 14       79
                 Premium scheme  –                –             0     6 ± 4            9 ± 6        70
                 All sites       65 ± 12          163 ± 29     108   47 ± 3           79 ± 5       380
   282   283   284   285   286   287   288   289   290   291   292